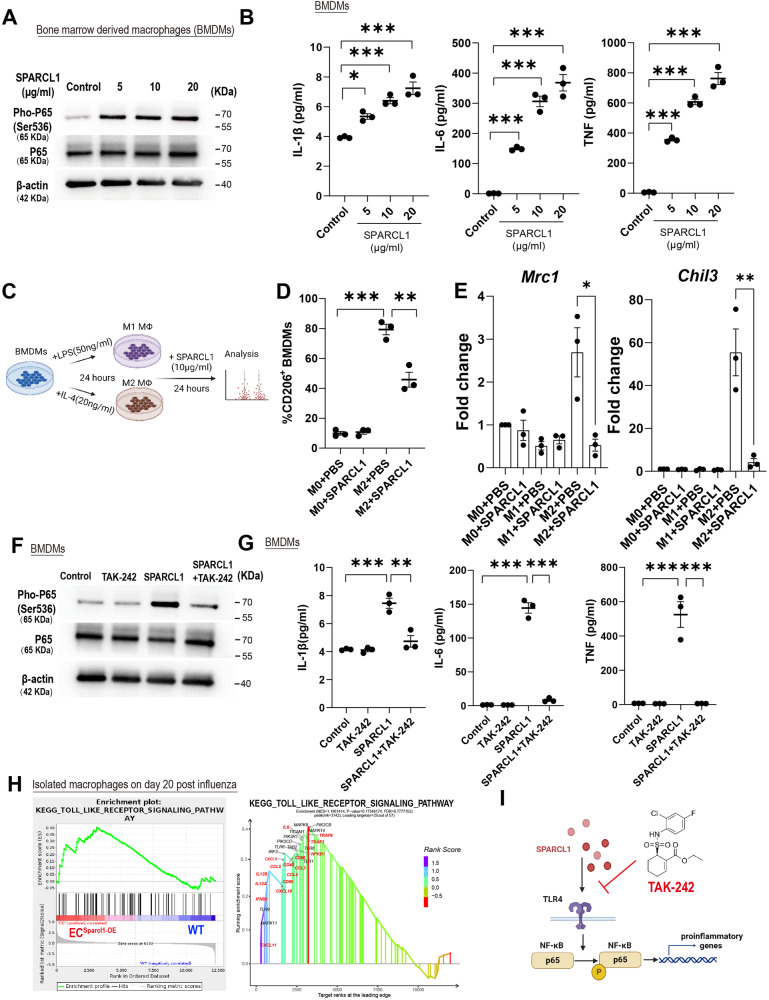
Fig. 5. Sparcl1 induction of M1-like macrophages depends on TLR4 in vitro.
A Western blotting analysis of indicated proteins in bone marrow-derived macrophages (BMDMs) treated with different doses of recombinant SPARCL1 protein (0–20 μg/ml) for 1 h, representative image from n = 3 biological replicates. B BMDMs were treated with different doses of recombinant SPARCL1 protein (0–20 μg/ml, Sino Biological) for 24 h, and cell supernatant was collected. Pro-inflammatory cytokines IL-1β, IL-6 and TNF levels in supernatant were measured by ELISA, n = 3 biological replicates per group. IL-1β: p = 0.01 (Control vs. 5), p = 0.0003 (Control vs. 10), p < 0.0001 (Control vs. 20); IL-6: p = 0.0005 (Control vs. 5), p < 0.0001 (Control vs.10), p < 0.0001 (Control vs. 20); TNF: p < 0.0001 (Control vs. 5), p < 0.0001 (Control vs. 10), p < 0.0001 (Control vs. 20). C Schematic of SPARCL1 treatment of BMDMs. D Quantification of the proportion of M2-like (F4/80+CD206+) macrophages in M2 polarized BMDMs after being treated with SPARCL1 (10 μg/ml, Sino Biological) for 24 h. n = 3 biological replicates per group. M0 + PBS vs. M2 + PBS: p < 0.001; M2 + PBS vs. M2 + SPARCL1: p = 0.003. E qPCR analysis for M2 macrophage genes (Chil3 and Mrc1) in M1 and M2 polarized BMDMs after being treated with SPARCL1 (10 μg/ml) for 24 h, n = 3 biological replicates per group. Mrc1:M2 + PBS vs. M2 + SPARCL1: p = 0.021; Chil3:M2 + PBS vs. M2 + SPARCL1: p = 0.0098. F BMDMs were pre-treated with TLR4 inhibitor, TAK-242(10 μM) for 1 h and then incubated with or without SPARCL1 (10 μg/ml, Sino Biological) for 1 h. Phosphorylation of NF-κB was detected by western blot assay, n = 3 biological replicates per group. G BMDMs were pre-treated with TLR4 inhibitor, TAK-242(10 μM) for 1 h and then incubated with or without SPARCL1 (10 μg/ml, Sino Biological) for 24 h, and cell supernatant was collected. Pro-inflammatory cytokines IL-1β, IL-6 and TNF levels in supernatant were measured by ELISA, n = 3 biological replicates per group. IL-1β (Control vs. SPARCL1: p = 0.0002; SPARCL1 vs. SPARCL1 + TAK-242: p = 0.006); IL-6 (Control vs. SPARCL1: p < 0.0001; SPARCL1 vs. SPARCL1 + TAK-242: p < 0.0001); TNF (Control vs. SPARCL1: p < 0.0001; SPARCL1 vs. SPARCL1 + TAK-242: p < 0.0001). H GSEA analysis indicates that endothelial overexpression of Sparcl1 in vivo positively engaged the TLR4 signaling in isolated macrophages (see Fig. 4G–I). I The TLR4 inhibitor TAK-242 blocks SPARCL1-induced NF-κB activation, thereby inhibiting macrophage transition to a pro-inflammatory phenotype. Data in B, D, and G are presented as means ± SEM, calculated using one-way analysis of variance (ANOVA), followed by Dunnett’s multiple comparison test. Data in E are presented as means ± SEM, calculated using unpaired two-tailed t-test; *P < 0.05, **P < 0.01, ***P < 0.001. Source data are provided as a Source Data file. Schematics and icons created with BioRender.com.

