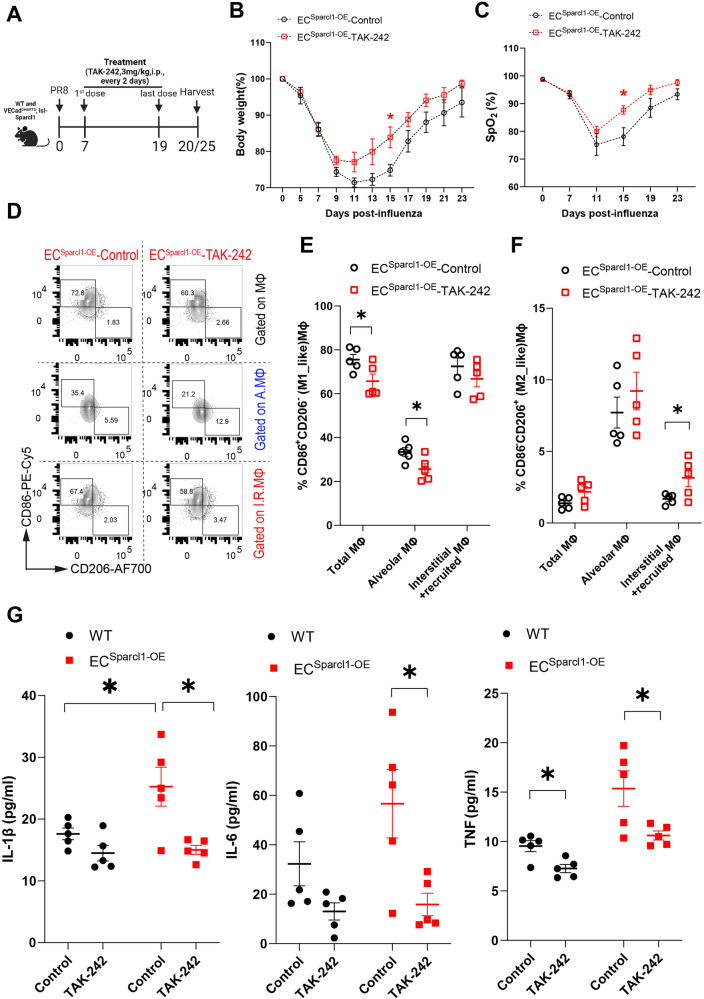
Fig. 6. Blockade of TLR4 ameliorates the exacerbation of pneumonia induced by endothelial overexpression of Sparcl1.
A Timeline for TAK-242 administration and sampling. WT and ECSparcl1-OE mice were treated with TAK-242 (3 mg/kg, i.p.) or equal volume of vehicle control (DMSO). B and C Time course of changes in (B) body weight and (C) capillary oxygen saturation in ECSparcl1-OE mice treated with or without TAK-242 after influenza infection. B n = 6 mice per group, independent biological replicates; D15: Control vs. TAK-242: p = 0.02; C Control: n = 5 mice, independent biological replicates, TAK-242: n = 6 mice, independent biological replicates; D15: Control vs. TAK-242: p = 0.018. D Representative gating scheme for identification of M1-like (CD86+CD206−) and M2-like (CD86−CD206+) macrophages in total lung macrophages (CD45+Ly6G−CD64+F4/80+), alveolar macrophages (CD45+Ly6G−CD64+F4/80+SiglecF+), and interstitial and recruited macrophages (CD45+Ly6G−CD64+F4/80+SiglecF−) at day 20 after influenza infection in ECSparcl1-OE mice treated with or without TAK-242, Macrophage gating strategies as shown in Supplementary Fig. 11A. E and F Quantification of the proportion of E M1-like (CD86+CD206−) and F M2-like (CD86−CD206+) macrophages in total lung macrophages (CD45+Ly6G−CD64+F4/80+), alveolar macrophages (CD45+Ly6G−CD64+F4/80+SiglecF+) and interstitial and recruited macrophages (CD45+Ly6G−CD64+F4/80+SiglecF−) at day 20 after influenza infection in WT and ECSparcl1-OE mice treated with or without TAK-242, n = 5 mice per group, independent biological replicates. E p = 0.04 (total MΦ), p = 0.038 (alveolar MΦ). F p = 0.045 (interstitial + recruited MΦ). G The levels of pro-inflammatory cytokines, IL-1β, IL-6 and TNF in bronchoalveolar lavage fluid (BALF) were measured by ELISA in WT and ECSparcl1-OE mice treated with or without TAK-242 at day 20 after influenza infection, n = 5 mice per group, independent biological replicates. IL-1β (Control: WT vs. ECSparcl1-OE: p = 0.048; ECSparcl1-OE mice: Control vs. TAK-242: p = 0.013); IL-6 (ECSparcl1-OE mice: Control vs. TAK-242: p = 0.023); TNF (WT mice: Control vs. TAK-242: p = 0.011; ECSparcl1-OE mice: Control vs. TAK-242: p = 0.033). Data in B, C, E, and F are presented as means ± SEM, calculated using unpaired two-tailed t-test; Data in G are presented as means ± SEM, calculated using one-way analysis of variance (ANOVA), followed by Dunnett’s multiple comparison test. *P < 0.05. Source data are provided as a Source Data file.

