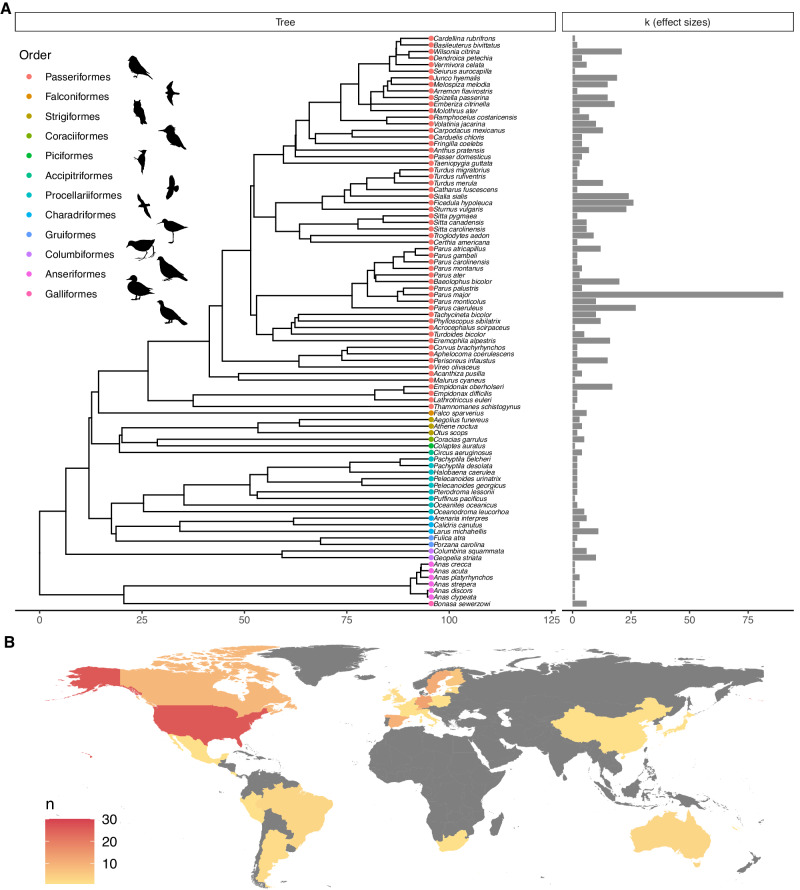
Fig. 2. Illustration of phylogenetic and geographic breadth of estimates included in meta-analysis.
A Shows the phylogenetic relationships used in the meta-regression, grouped by order and the associated mean effect size for response to manipulations of perceived predation risk for k estimates from K studies. B Shows the geographic distribution of studies, where the colour of the country on a gradient from yellow to red represents the total number of studies (n). Grey is used for countries from which no estimates were obtained. Silhouettes representing different bird orders were obtained from PhyloPics, with artist credits and copyright: T. Michale Keesey (PDM 1.0), Ferran Sayol (CC0 1.0), Gabriela Palomo-Munoz (CC BY-NC 3.0) Andy Wilson (CC0 1.0) and Alexandre Vong (CC0 1.0). Detailed copyright information for all images can be accessed at: https://www.phylopic.org/permalinks/4d2aebec1e2f2da818396c344eb377c61d6ce0d70ddb15d09d7671defdf00ed2.

