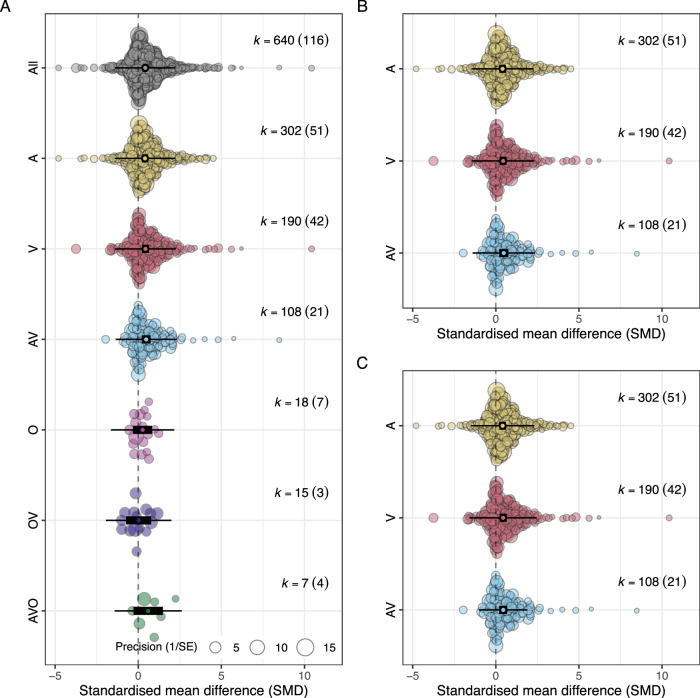
Fig. 3. Orchard plot of meta-analytic mean effect sizes, standardised mean difference (SMD or Hedge’s g) for each of six treatment levels for experimental manipulations of perceived predation risk: A = acoustic, AV = acoustic + visual, AVO = acoustic + visual + olfactory, O = olfactory, OV = olfactory + visual and V = visual.
The circles denote the meta-analytic means. Note that the black rectangles represent the 95% confidence intervals, while the whiskers denote the 95% prediction intervals. A Shows results from meta-analysis including all treatment levels. B, C Illustrate results from analyses restricted to the three most common cue types (A, V and AV). B Shows estimated effects from homoscedastic model, and (C) shows estimated effects from heteroscedastic model. Total number of estimates (k) is given on to the right of each plot with the number of studies contributing estimates in parentheses.

