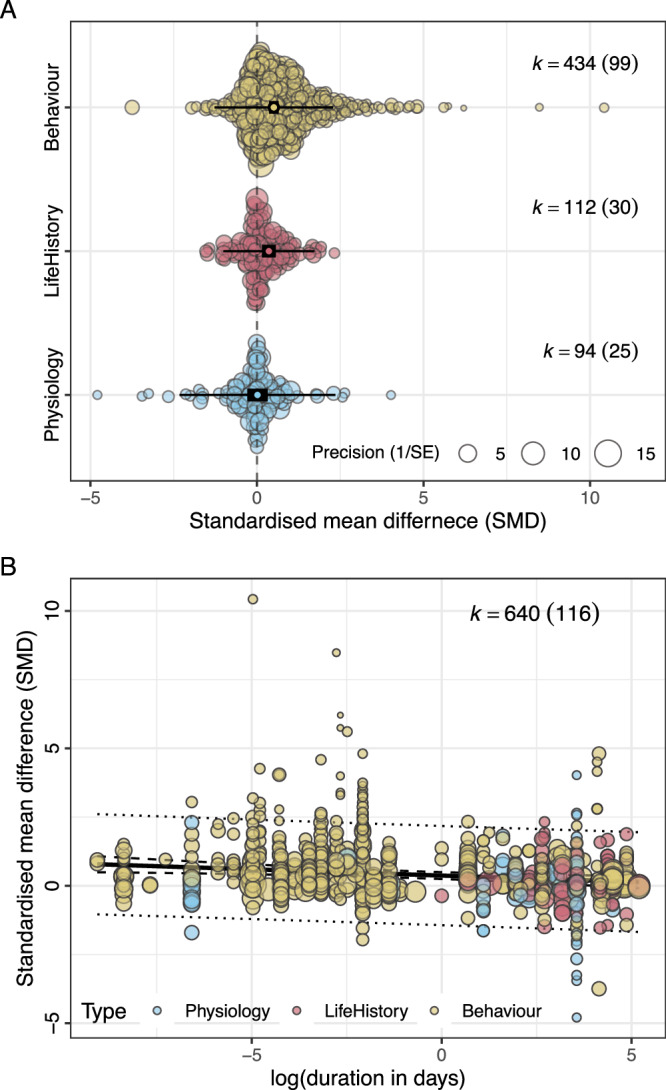
Fig. 4. Illustration of the effect of significant moderators of the effect of manipulations of perceived predation risk in birds.

Magnitude of response varies as a function of (A) response type (behaviour, life history, or physiology), and (B) declines with increasing treatment duration. However, different treatment durations tend to be associated with different response types as shown in (B), making it difficult to tease apart their effects. In (A), the circles denote the meta-analytic means. Note that the black rectangles represent the 95% confidence intervals, and whiskers denote the 95% prediction intervals. In (B), the regression is plotted with 95% confidence intervals (inner dotted line) and 95% prediction intervals (outer dotted line). Total number of estimates (k) is given on to the right of each plot, with the number of studies contributing estimates in parentheses.
