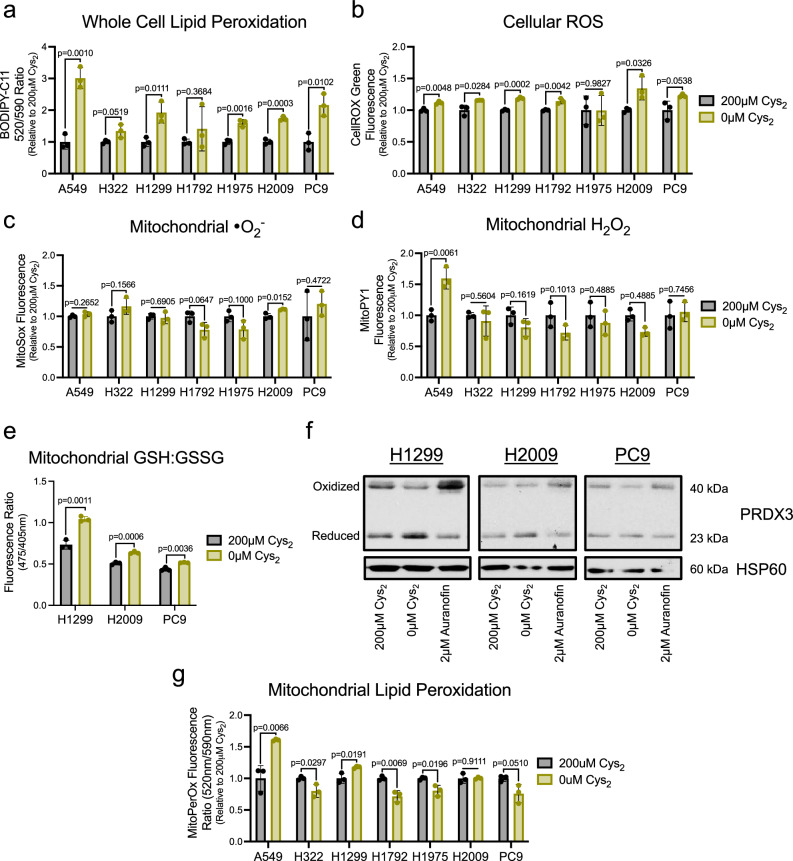
Fig. 2. Cys2 starvation does not promote mitochondrial oxidative stress.
Following culture in the presence or absence of cystine, NSCLC cells were treated with ROS-sensitive fluorescent dyes to determine the average relative levels of (a) cellular membrane lipid peroxides, (b) cellular ROS, (c) mitochondrial superoxide, or (d) mitochondrial hydrogen peroxide (n = 3 biologically independent samples per condition for each experiment). e Ratio of Mito-Grx1-roGFP2 fluorescence as indicative of the proportion of the biosensor bound to reduced (GSH) or oxidized (GSSG) glutathione in H1299, H2009, and PC9 cells cultured with or without cystine for 16 h (n = 3 biologically independent samples per condition). f Redox immunoblotting of HSP60 and the PRDX3 oxidation state in H1299, H2009, and PC9 cells following culture with the indicated [cystine] or 1 h treatment with auranofin. g Relative MitoPerOX fluorescence ratio of NSCLC cells cultured in the presence or absence of cystine to indicate the extent of mitochondrial membrane lipid peroxidation (n = 3 biologically independent samples per condition). For (a–d, f, g) cells were cultured in the indicated [cystine] for 20 h prior to the indicated analysis. Data represent mean values ± s.d. For (a–e, g) P values were calculated using two-tailed unpaired Student’s t-test. All data are representative of at least 3 experimental replicates. For (a–g), source data provided as a Source Data file.

