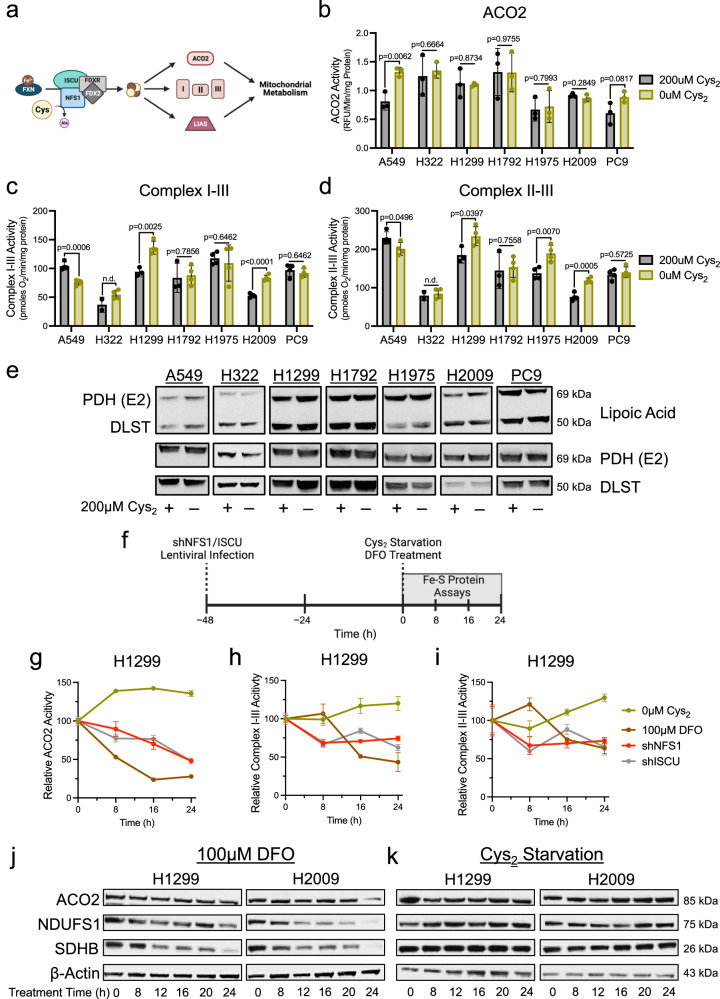
Fig. 3. Fe-S protein function is preserved under Cys2 deprivation.
a Schematic of Fe-S cluster synthesis and its contribution to enzymatic function that supports mitochondrial metabolism; Ala, alanine, Cys, cysteine, Fe2+, iron, I, complex I, II, complex II, III, complex III. b ACO2 activity in mitochondrial lysates of NSCLC cells fed or starved of cystine (n = 3 biologically independent samples per condition). c Supercomplex I-III activity in permeabilized NSCLC cells following culture in the presence or absence of cystine (n = 4 biologically independent samples per condition, except when n = 2 for H322 + 200 μM and n = 3 for H1299 and H1792 + 200 μM). d Supercomplex II-III activity in permeabilized NSCLC cells following culture in the presence or absence of cystine (n = 4 biologically independent samples per condition, except when n = 2 for H322 + 200 μM and n = 3 for H1299 and H1792 + 200 μM). e Immunoblot analysis of PDH complex subunit E2 and α-ketoglutarate dehydrogenase subunit DLST lipoylation following culture in cystine replete or starved conditions. f Experimental timeline for the assessment of Fe-S proteins in response to insults to Fe-S cluster synthesis (g–i). g ACO2 activity in mitochondrial lysates of H1299 cells following treatment with cystine starvation, DFO, or upon knockdown of NFS1 or ISCU at the indicated time points (n = 3 biologically independent samples per condition). h, i ETC supercomplex activities in permeabilized H1299 cells following treatment with cystine starvation, DFO, or upon knockdown of NFS1 or ISCU at the indicated time points (n = 3 biologically independent samples per condition). For (g–i), data points are representative of the activity of each Fe-S protein relative to the activity of that protein at time 0 h. Immunoblot analyses of mitochondrial Fe-S proteins (ACO2, NDUFS1, and SDHB) in H1299 and H2009 cells following culture in (j), cystine-deficient media or (k), DFO for the indicated time. For (g–i), all cells were cultured in the presence of 1 μM ferrostatin-1. Data represent mean values ± s.d; n.d. not determined. For (b–d) P values were calculated using two-tailed unpaired Student’s t-test. All data are representative of at least 3 experimental replicates. a, f created with BioRender.com released under a Creative Commons Attribution-NonCommercial-NoDerivs 4.0 International license, https://creativecommons.org/licenses/by-nc-nd/4.0/deed.en. For (b–e) and (g–k), source data provided as a Source Data file.

