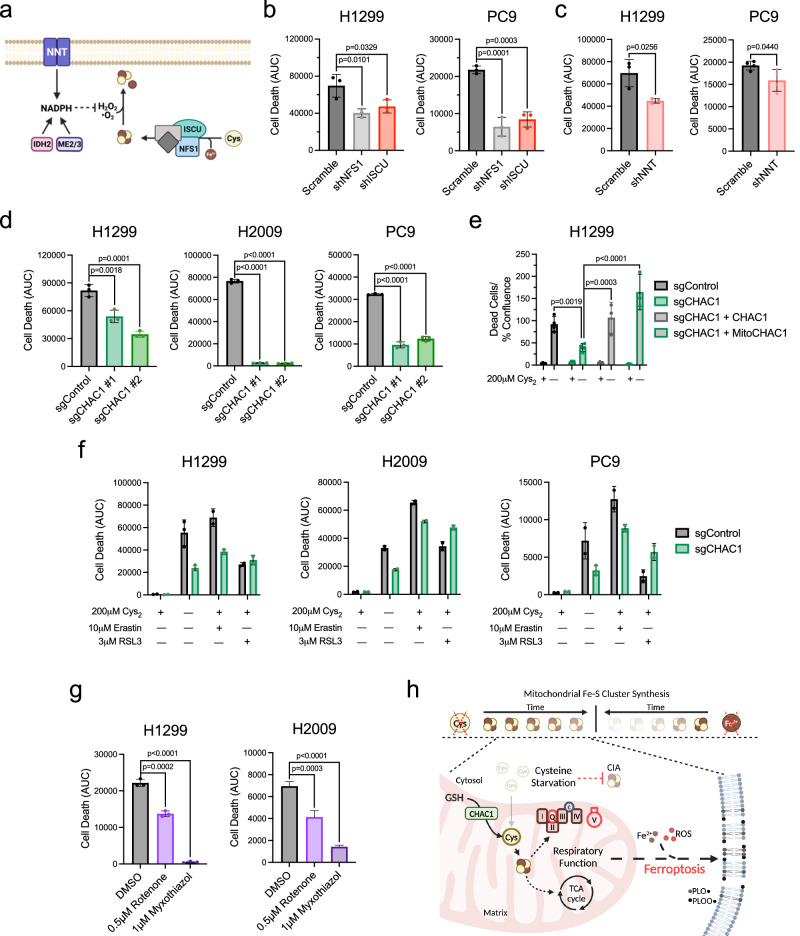
Fig. 6. Mitochondrial respiratory function antagonizes NSCLC viability in the absence of extracellular Cys2.
a Schematic representation of the two major aspects of Fe-S cluster homeostasis: de novo synthesis and mitigation of cluster oxidation; Cys, cysteine, Fe2+, iron, H2O2, hydrogen peroxide, NADPH, nicotinamide adenine dinucleotide phosphate, •O2−, superoxide. b, c Quantification of cell death over 48 h of cystine starvation in H1299 and PC9 cells following the disruption of Fe-S cluster homeostasis through shRNA knockdown of (b) NFS1 and ISCU (n = 3 biologically independent samples per condition), or (c) NNT (n = 3 biologically independent samples per condition for H1299, and n = 4 for PC9). d Measurement of CHAC1-deficient NSCLC cell death under 48 h of cystine starvation (n = 3 biologically independent samples per condition). e Quantification of cell death in control, CHAC1-defcient, or CHAC1-reconstituted H1299 cells following a 48 h incubation in the presence or absence of cystine (n = 4 biologically independent samples per condition, except when n = 3 for sgCHAC1 + CHAC1-0 μM and sgCHAC1 + MitoCHAC1-0 μM). f Analysis of CHAC1-deficient NSCLC cell death over 48 h of treatment with indicated inducers of ferroptosis (n = 2 biologically independent samples per condition, except when n = 3 for H1299 + sgControl-DMSO-0 μM, H1299 + sgCHAC1-DMSO-0 μM, and PC9 + sgCHAC1-DMSO-0 μM). g Quantification of cell death over 48 h in H1299 and H2009 cells subject to ETC inhibition under cystine starvation (n = 3 biologically independent samples per condition). h Summary schematic depicting that mitochondrial Fe-S cluster synthesis is more resistant to sulfur (Cys) than iron restriction due to CHAC1 catabolism of mitochondrial GSH. This contrasts with the cytosolic iron-sulfur cluster assembly system (CIA), which exhibits sensitivity to Cys starvation. The persistence of respiratory function under Cys limitation potentiates the iron-mediated generation of membrane phospholipid alkoxyl (PLO•) and peroxy (PLOO•) radicals that mediate ferroptosis; GSH glutathione, ROS reactive oxygen species. Data represent mean values ± s.d. For (b–g) data are representative of at least 3 experimental replicates. For (b–d) and (g) P values were calculated using a one-way ANOVA. For (e) P values were calculated using a two-way ANOVA with a Šidák’s multiple comparisons test. a, h created with BioRender.com released under a Creative Commons Attribution-NonCommercial-NoDerivs 4.0 International license, https://creativecommons.org/licenses/by-nc-nd/4.0/deed.en. For b–g, source data provided as a Source Data file.

