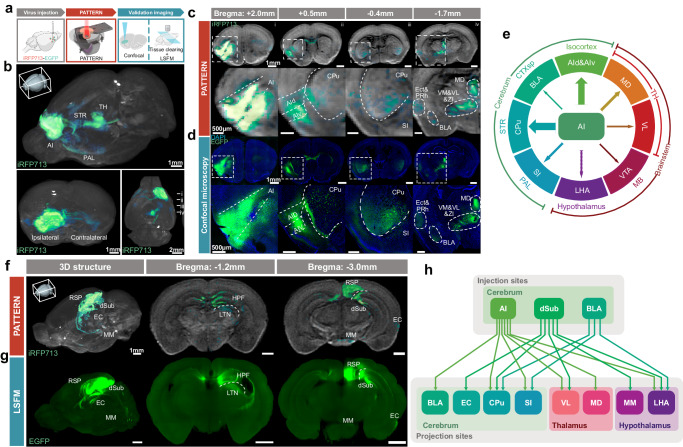
Fig. 4. PATTERN for visualizing neural connectivity of the brain.
a The pipeline for PATTERN imaging followed by validation imaging. Partially created with BioRender.com released under a Creative Commons Attribution-NonCommercial-NoDerivs 4.0 International license https://creativecommons.org/licenses/by-nc-nd/4.0/deed.en. b 3D-view imaging of the projection map of AI from three directions via PATTERN, striatum (STR), thalamus (TH) and pallidum (PAL). Coronal sections of PATTERN images (c) and confocal images (d) at the injection site (i) and some projection sites (ii–iv). The second row of each modality is the amplification of the signal area (outline with a white box), anterior insular cortex dorsal part (AId), anterior insular cortex ventral part (AIv), caudoputamen (CPu), sybstantia innominata (SI), ectorhinal area (Ect), periehinal cortex (PRh), ventromedial thalamic nucleus (VM), ventrolateral thalamic nucles (VL), zona incerta (ZI) and mediodorsal thalamic nucleus (MD). e The major downstream brain regions diagram of AI, lateral hypothalamic nucleus (LHA), midbrain (MB) and ventral tegmental area (VTA). The 3D and coronal images via PATTERN (f) and LSFM (g) retrosplenial area (RSP), entorhinal cortex (EC), medial mammillary nucleus (MM), hippocampal formation (HPF) and laterodorsal thalamic nucleus (LTN). h The projection map diagram of the connection atlas from the AI, dSub and BLA.

