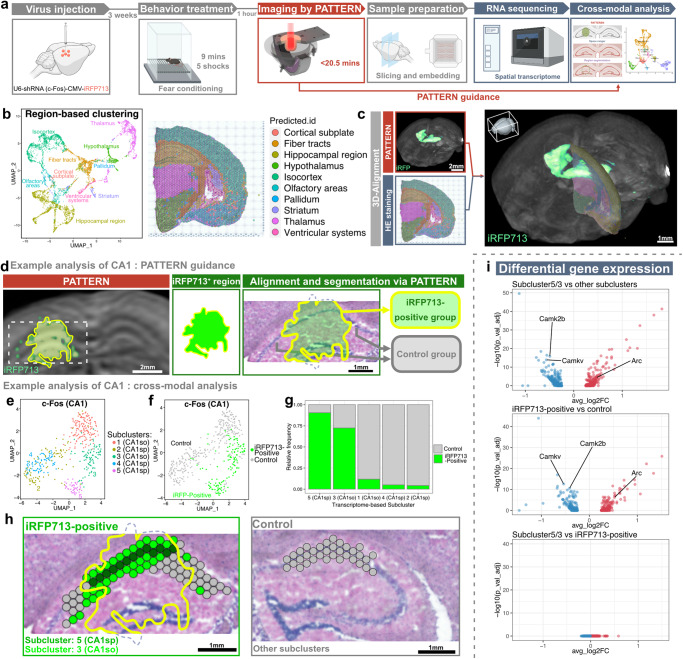
Fig. 6. PATTERN for cross-modal transcriptome analysis of an individual brain.
a Pipeline of combining PATTERN and spatial transcriptome. Partially created with BioRender.com released under a Creative Commons Attribution-NonCommercial-NoDerivs 4.0 International license https://creativecommons.org/licenses/by-nc-nd/4.0/deed.en. b Region-based UMAP clustering and spatial map of a hemisphere. c 3D alignment of spatial transcriptome data to whole-brain images by PATTERN. d Pipeline of fluorescence alignment for the CA1 example. UMAP clustering of CA1 spots labeled by brain-region (e) or fluorescence (f). g Relative ratio of fluorescence-positive spots in each subcluster. Specifically, a CA1sp subcluster and a CA1so subcluster were labeled intensively. h Spatial identification of subclusters and manipulated regions. i Differential gene expression of different subclusters. Transcriptome-based selected subclusters are highly correlated with fluorescence-positive subclusters at the gene expression level. A two-sided Wilcoxon Rank Sum test was performed and the p value was adjusted based on bonferroni correction.

