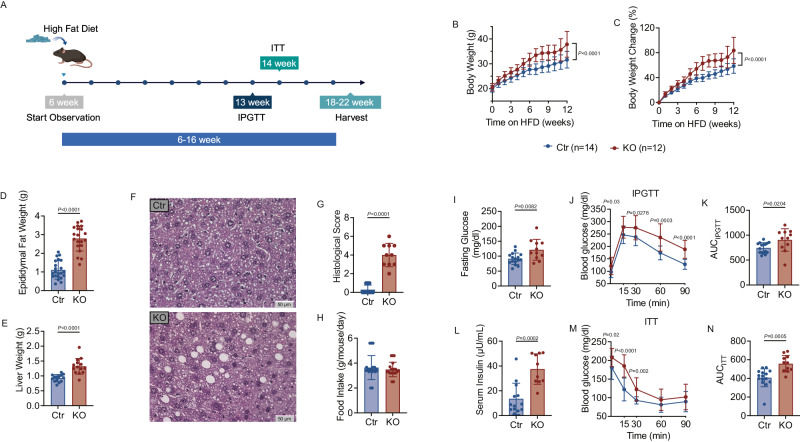
Fig. 1. B Cell–Specific Tlr9 deficiency accelerates Obesity.
Tlr9 deletion in B cells (Tlr9fl/fl/Cd19Cre+/- B6) promotes high fat diet-induced obesity (HFDIO) in C57BL/6 mice. Tlr9fl/fl/Cd19Cre+/- B6 (KO) male mice and Tlr9fl/fl/Cd19Cre-/- B6 control (Ctr) male mice were fed with HFD at 6 weeks of age. A Experimental design of high fat diet induced obesity (HFDIO). The mice were monitored body weight (BW) weekly at the beginning of HFD (6 weeks of age). Intraperitoneal glucose tolerance test (IPGTT) was assessed at 13 weeks old. Insulin tolerance test (ITT) was assessed at 14 weeks old. The mice were terminated at 18–22 weeks of age. Graph was created with BioRender.com. B Net body weight change: body weight was measured weekly from the commencement of HFD (week 0) (KO: n = 12 mice, Ctr: n = 14 mice). C Body weight change (%) of KO and Ctr mice. D Epididymal fat weight of the KO and Ctr mice after 12 weeks of HFD (KO: n = 20 mice, Ctr: n = 22 mice). E Liver weight of the KO mice and the control mice after 12 weeks of HFD (n = 14 mice per group). F Representative liver sections after staining with H&E. 40×. G Histological scores of liver sections with H&E. H Food intake of the KO and Ctr mice (n = 20 mice per group). I Fasting glucose levels of the KO and Ctr mice (KO: n = 11 mice, Ctr: n = 16 mice). J IPGTT results of the KO and the control mice at 13 weeks old (KO: n = 11 mice, Ctr: n = 16 mice). K Area under the curve (AUC) of the IPGTT of J. L Serum insulin levels of the KO and Ctr mice (KO: n = 10 mice, Ctr: n = 13 mice). M ITT results of the KO and control mice at 14 weeks old (KO: n = 11 mice, Ctr: n = 15 mice). N Area under the curve (AUC) of the ITT of M. All the data were from two independent experiments. A, B were analyzed using two-way ANOVA and C–M were analyzed using two-tailed Student’s t-test. I, L were analyzed using multiple Student’s t-test. The data are presented as mean ± SD. The experiment was performed 3 times and the pooled results are presented in the figure.

