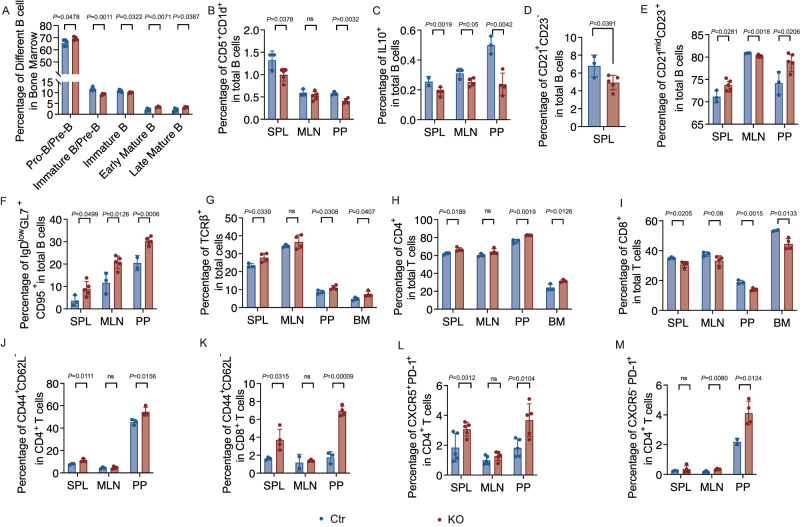
Fig. 2. Tlr9 deficiency in B cells alters the phenotype of different immune cell subsets.
Immune cells from different lymphoid tissues (as indicated) in Tlr9fl/fl/Cd19Cre+/- B6 (KO) and Tlr9fl/fl/Cd19Cre-/- B6 (Ctr) mice (all males, 18–22-week-old) were prepared and analyzed using flow cytometry after staining with different markers and Zombie Dye. All the samples were first gated on Zombie Dye negative cells followed by further gating on different immune cell subsets. A–F Immune-phenotype of B cells (gated on B220+) in KO and Ctr mice. A B cells were first gated on B220+ cells. The proportion of Pro-Pre B cells (CD24+,CD43-, IgD-, IgM-), immature-Pre B cells (CD24+,CD43-, IgD-, IgMmid), immature B cells (CD24+,CD43-, IgD-, IgM+), early mature B cells (CD24+,CD43-, IgD+, IgM+) and late mature B cells (CD24+,CD43-, IgD+, IgM-), in the bone marrow (KO: n = 4 mice, Ctr: n = 5 mice). B The proportion of CD5+CD1d+ B cells in SPL, MLN, PP of the KO and the Ctr mice (KO: n = 5 mice, Ctr: n = 3 mice). C The proportion of B cells expressing IL-10 (KO: n = 4 mice s, Ctr: n = 3 mice). D The proportion of CD21+CD23- marginal zone (MZ) B cells (KO: n = 5 mice, Ctr: n = 3 mice). E The proportion of CD21midCD23+ follicular (FO) B cells (KO: n = 5 mice, Ctr: n = 3 mice). F The proportion of IgDlowGL7+CD95+ germinal center (GC) B cells (KO: n = 5 mice, Ctr: n = 3 mice). G–M Immune-phenotype of T cells (gated on TCRβ+) in KO mice and Ctr mice by flow cytometric analysis. G The proportion of total TCRαβ+ T cells (KO: n = 4 mice, Ctr: n = 3 mice). H Frequency of CD4+ T cells (KO: n = 4 mice, Ctr: n = 3 mice). I The proportion of CD8+ T cells (KO: n = 4 mice, Ctr: n = 3 mice). J The proportion of CD44+CD62L- memory CD4+ T cells (KO: n = 4 mice, Ctr: n = 3 mice). K The proportion of CD44+CD62L- memory CD8+ T cells (KO: n = 4 mice, Ctr: n = 3 mice). L The proportionof CXCR5+ PD-1+ follicular T helper (TFH) CD4+ T cells (KO: n = 5 mice, Ctr: n = 5 mice). M The proportion of CXCR5-PD-1+ peripheral helper (TPH) CD4+ T cells (KO: n = 4 mice, Ctr: n = 3 mice). All the experiments were repeated three times with similar results. Data were analyzed using two-tailed Student’s t-test. The data are presented as mean ± SD. The data presented in the figures are from one of the experiments. The total cell numbers of the immune cells in each subset is presented in Supplementary Fig. 3.

