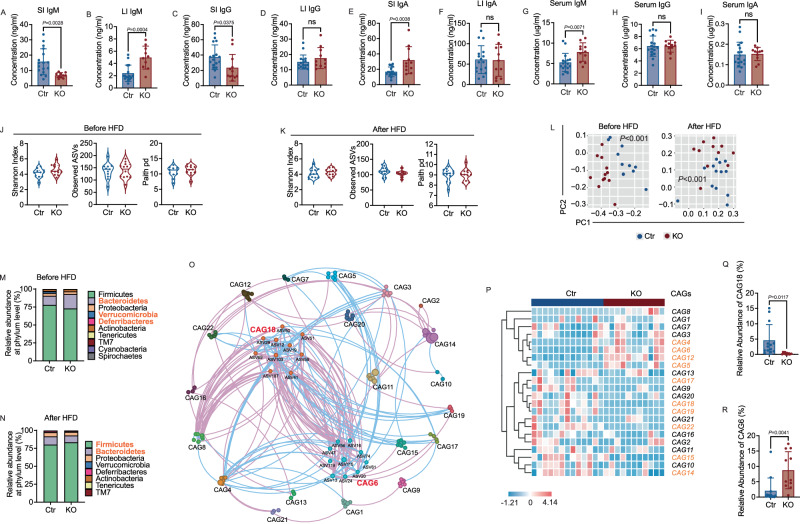
Fig. 5. Tlr9 deficiency in B cells changes the levels of mucosal immunoglobulins and gut microbiota composition.
Immunoglobulins (IgM, IgG and IgA) from intestinal flush and serum samples from KO and Ctr mice, all males, after HFD were assessed by ELISA. Fecal pellets were collected from male KO and Ctr male mice before and after 12-week feeding with HFD. Bacterial DNA was extracted and the microbial composition was assessed by 16 S rRNA gene deep sequencing. A–F Concentrations of IgM, IgG, IgA in small intestinal gut flush (SI) and large intestinal gut flush (LI) from 18-22-week-old KO and Ctr male mice were determined by ELISA with a standard curve for each Ig (KO: n = 10–12 mice, Ctr: n = 17 mice). G–I Concentrations of IgM, IgG, IgA in serum from the same KO and Ctr mice (KO: n = 11 mice, Ctr: n = 17 mice). J, K α diversity (Shannon Index, Observed ASVs and Paith pd) of gut microbiota in the mice before and after HFD. L The overall structure of the gut microbiota in both Ctr and KO group mice, before and after HFD, was assessed. Principal coordinate analysis (PCoA) was carried out using Bray-Curtis distance metrics at the Amplicon Sequence Variants (ASVs) level. M, N The relative abundance of gut microbiota at the phylum level in the KO group and Ctr group before and after HFD. The phyla marked in bold orange indicate significant differences between the two groups. J–N Before HFD: KO: n = 12 mice, Ctr: n = 11 mice. After HFD: KO: n = 11 mice, Ctr: n = 13 mice. O Microbial interaction network displays the interaction between different Co-abundant groups (CAGs) after HFD. The size of node represents the mean abundance of ASV, being larger size, higher abundance. The lines between the nodes indicate correlation (pink = negative correlation, blue = positive correlation), width of the lines corresponding to magnitude of the correlation. P The heatmap of CAGs in Ctr group and KO group after HFD. The CAG number highlighted in bold orange indicate significant differences between the two groups by PERMANOVA. Q, R The relative abundance of CAG6 and CAG18 between Ctr and KO group (KO: n = 11 mice, Ctr: n = 13 mice). The data in A–I are shown as the mean ± SD, and Student’s t-test (two-tailed) was used to analyze difference between Ctr and KO groups. The experiment was performed 3 times and the pooled results are presented in the figure.

