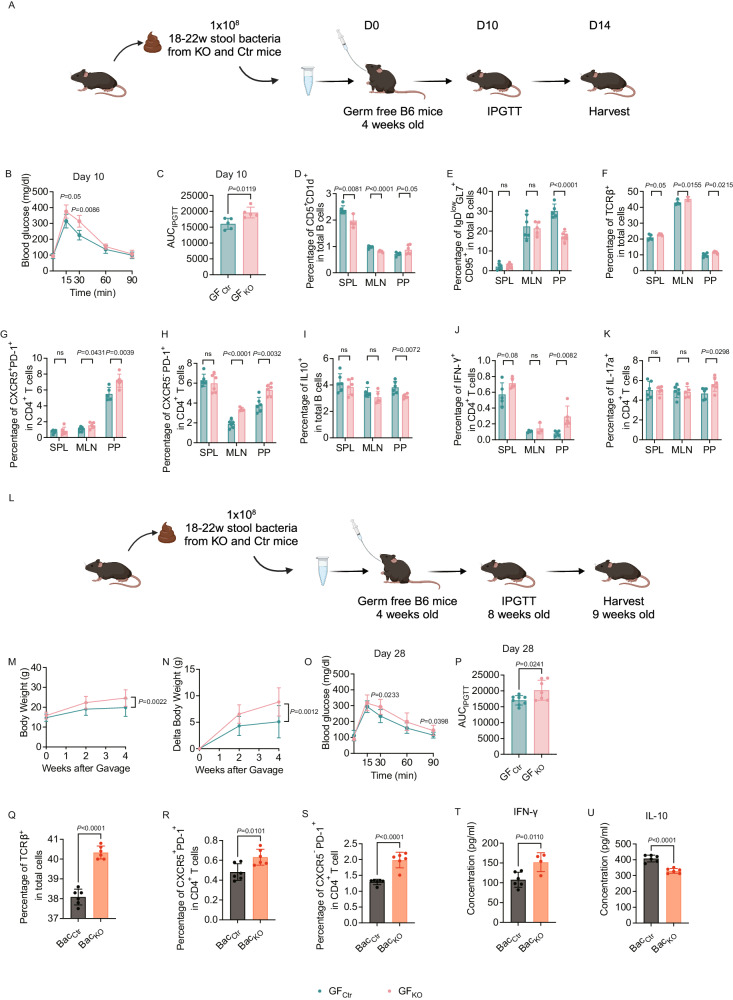
Fig. 6. Altered gut microbiota from Tlr9fl/fl/Cd19Cre+/- B6 mice can transfer the immunological and metabolic phenotype to germ-free (GF) mice in vivo and influence immune cells in vitro.
Microbiota from pooled fecal samples collected from the KO and the Ctr male mice after 12–16 wks of HFD were used to colonize wild type GF B6 mice (4 weeks of age) by oral gavage. A The experimental procedure of fecal microbiota transfer (FMT) to germ free (GF) B6 mice (short-term, 2 weeks). GF wild type B6 mice (4 weeks old) were gavaged with 1 × 10⁸ cfu gut microbiota from the pooled stool samples of Tlr9fl/fl/Cd19Cre+/- (KO) and Tlr9fl/fl/Cd19Cre-/-B6 (Ctr) male mice. The recipient GF B6 mice were maintained on normal diet. IPGTT was assessed 10 days post FMT. The experiment was terminated 14 days after FMT. Graph was created with BioRender.com. B IPGTT results of the ex-GF B6 mice, 10 days post gavage (n = 5 mice per group). C Area under the curve (AUC) of the IPGTT results from A (n = 5 mice per group). D–K Immune cell phenotype of ex-GF B6 mice assessed by flow cytometric analysis, 14 days after gut microbiota colonization. D Proportion of CD5+CD1d+ B cells (gated on B220+) (n = 6 mice per group). E Proportion of IgDlowGL7+CD95+ B cells (n = 6 mice per group). F Proportion of total TCRαβ+ T cells (n = 5 mice per group). G Proportion of CXCR5+PD-1+CD4+ T cells (n = 6 mice per group). H Proportion of CXCR5-PD-1+ CD4+ T cells (n = 6 mice per group). I Proportion of IL-10-expressing B cells (n = 6 mice per group). J Proportion of IFN-γ-expressing CD4+ T cells (n = 5 mice per group). K Proportion of IL-17a-expressing CD4 T+ cells (n = 6 mice per group). L The experimental procedure of fecal microbiota transfer (FMT) to GF B6 mice (long-term, 4 weeks). GF wild type B6 mice (4 weeks old) were gavaged with 1 × 10⁸ cfu gut microbiota from the pooled stool samples of Tlr9fl/fl/Cd19Cre+/- (KO) and Tlr9fl/fl/Cd19Cre-/-B6 (Ctr) male mice (12–16 weeks post HFD). The recipient GF B6 mice were maintained on normal diet. IPGTT was assessed 4 weeks after FMT. The experiment was terminated 5 weeks after FMT. Graph was created with BioRender.com. M Body weight change of the ex-GF B6 mice colonized with gut microbiota from KO (GFKO) and control mice (GFCtr) (GFKO: n = 7 mice, GFCtr: n = 9 mice). N Net body weight gain of the ex-GF B6 mice colonized with gut microbiota from Tlr9fl/fl /Cd19Cre+/- B6 mice or Tlr9fl/fl /Cd19Cre-/- B6 mice at 4 weeks post gavage (GFKO: n = 7 mice, GFCtr: n = 9 mice). O IPGTT results of the ex-GF B6 mice 4 weeks after colonization with gut microbiota from KO and Ctr mice (GFKO: n = 7 mice, GFCtr: n = 8 mice). P Area under the curve (AUC) of the IPGTT results in M (GFKO: n = 7 mice, GFCtr: n = 8 mice). Q–U Gut microbiota from B cell Tlr9-deficient mice affect immune cell phenotype and cytokine profile in vitro. Q Frequency of total T cells after culture (n = 6 wells per group). R Frequency of CXCR5+PD-1+CD4+ T cells after culture (n = 6 wells per group). S Frequency of CXCR5-PD-1+CD4+ T cells after culture (n = 6 wells per group). T Secreted IFN-γ levels in the culture supernatants (BacKO: n = 4 wells, BacCtr: n = 6 wells). U Secreted IL-10 levels in the culture supernatants (n = 6 samples per group). All the data were repeated twice with similar results. K&L were analyzed using two-way ANOVA. Other data were analyzed using two-tailed Student’s t-test. The data are presented as mean ± SD. The cell numbers of D–K are shown in Supplementary Fig. 8.

