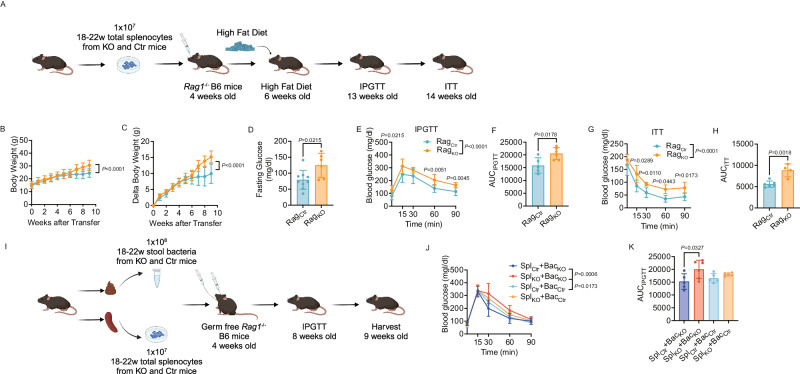
Fig. 7. Tlr9 deficiency in B cells leads to a metabolic disorder in immunodeficient Rag-/- B6 mice mediated by the immune system and gut microbiota.
SPF Rag1-/- and GF Rag1-/- B6 mice were recipients for transfer of immune cells or/and gut microbiota from KO and Ctr donor mice. A The experimental procedure of immune cell adoptive transfer to SPF Rag1-/- B6 mice. SPF Rag1-/- B6 mice (4 weeks of age) were adoptively transferred (i.v.) 1 × 10⁷ total splenocytes from Tlr9fl/fl/Cd19Cre+/- (KO) and Tlr9fl/fl/Cd19Cre-/-B6 (Ctr) male donor mice (12–16 weeks post HFD). Two weeks after the immune cell transfer, the recipient Rag1-/- B6 mice (6 wks of age) were started with high fat diet. IPGTT and ITT were assessed when the mice were at 13 and 14 weeks of age, respectively. Graph was created with BioRender.com. B, C Body weight change and net body weight gain of the SPF Rag1-/- B6 mice transferred with the immune cells from KO and Ctr donors (RagKO: n = 7 mice, RagCtr: n = 8 mice). D Fasting glucose of the SPF Rag1-/- B6 recipient mice transferred with the immune cells from KO and control mice (RagKO: n = 9 mice, RagCtr: n = 6 mice). E IPGTT result of the SPF Rag1-/- B6 recipient mice transferred with immune cells from KO and Ctr donor mice (RagKO: n = 9 mice, RagCtr: n = 6 mice). F Area under the curve (AUC) of IPGTT results from D. G ITT result of the SPF Rag1-/- recipient B6 mice transferred with immune cells from KO and control donors (RagKO: n = 4 mice, RagCtr: n = 6 mice). H Area under the curve (AUC) of the ITT of the results from F. I The experimental procedure of immune cell adoptive transfer and fecal microbiota transfer (FMT) to germ free Rag1-/- B6 mice. Germ free Rag1-/- B6 mice (4 weeks of age) were adoptively transferred (i.v.) 1 × 10⁷ total splenocytes and gavaged with 1 × 10⁸ gut microbiota from the pooled stool samples from Tlr9fl/fl/Cd19Cre+/- (KO) or Tlr9fl/fl/Cd19Cre-/-B6 (Ctr) male donor mice (12–16 weeks post HFD). The recipient mice were maintained on normal diet. IPGTT was assessed 4 weeks after the FMT and immune cell transfer. The experiment was terminated 5 weeks after the FMT and immune cell transfer. Graph was created with BioRender.com. J IPGTT result of GF Rag1-/- B6 mice transferred with the immune cells from KO and Ctr donors and colonized with the bacteria from the same KO and Ctr donor mice (n = 5 mice per group). K Area under the curve (AUC) of the IPGTT of the results from J. All the experiments were repeated twice with similar results. B, C, E, G, J were analyzed using two-way ANOVA. K was analyzed using one-way ANOVA. D, F, H were analyzed using two-tailed Student’s t-test. The data are presented as mean ± SD.

