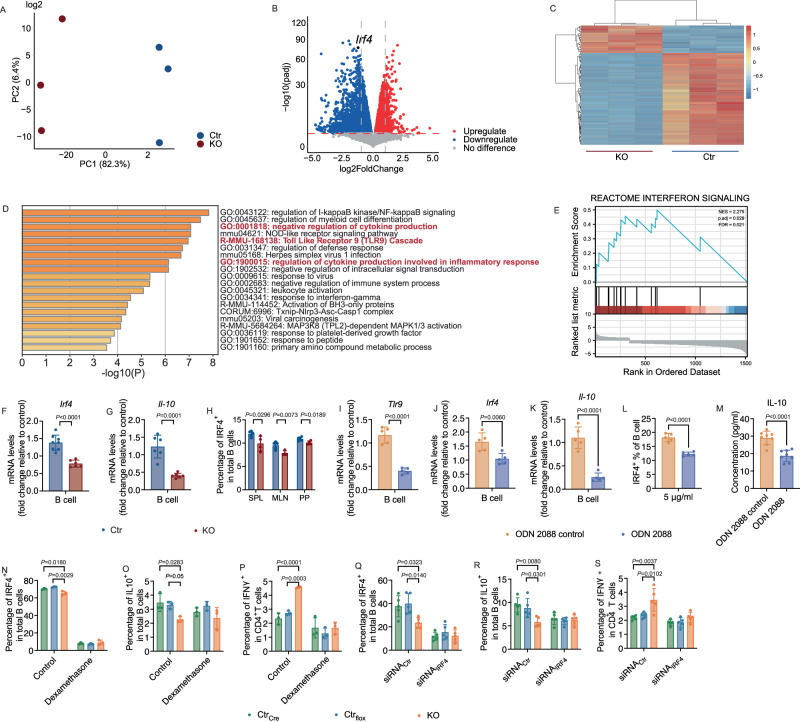
Fig. 8. Tlr9 regulates B cell function through Irf4 and Il-10.
Total RNA sequencing analysis was performed using purified B cells from 18-22-week-old male KO and Ctr mice (n = 3 mice per group). A Principal component analysis plot is shown comparing the sample diversity between the two groups. Blue and red represent the samples from Ctr and KO mice, respectively. B Volcano plot, differential gene expression (DGE) analysis was performed to compare combined gene expression in B cells from the two groups. Red represents up-regulated and blue represent down-regulated gene expressions (adjust p < 0.05). C Heatmap of top 100 differential genes, up-regulated and down-regulated genes were selected and clustered according to Gene Ontology analysis. The B cells from KO mice have more differentially down-regulated genes whereas the B cells from control mice have more differentially up-regulated genes. D Analysis of selected GO parent enrichment functions. E Analysis of GSEA (Gene Set Enrichment Analysis) pathway. NES = 2.275, p. adj = 0.029, FDR = 0.021. F Irf4 expression level in purified B cells by qPCR (KO: n = 6 mice, Ctr: n = 8 mice). G Il-10 expression level in purified B cells tested by qPCR (n = 6 mice per group). H Proportion of IRF4-expressing B cells from KO and Ctr mice by flow cytometric analysis (KO: n = 4 mice, Ctr: n = 5 mice). I–M Inhibition of TLR9 in purified B cells from control B6 mice recapitulates the phenotypic features of KO mice. Purified splenocytes from control B6 mice were cultured overnight in the presence of the TLR9 antagonist, ODN2088 and ODN2088 control. The cells were collected and washed post culture for qPCR and flow cytometric analysis. I–K Tlr9, Irf4 and Il-10 expression levels in the cultured B cells analyzed using qPCR (n = 5 wells per group). L The frequency of IRF4-expressing B cells by flow cytometric analysis after culture (n = 5 wells per group). M Secreted IL-10 levels in the supernatants of the cultured cells by ELISA (n = 8 wells per group). N–P Inhibition of IRF4 abolished the phenotype of reduction of IL-10-producing Bregs and increase of IFNγ-CD4+ T cells. Splenocytes from KO and two Ctr groups (Tlr9+/+/Cd19Cre+/-, designated as CtrCre, and Tlr9fl/fl/Cd19Cre-/-, designated as Ctrflox) were cultured with solvent or dexamethasone (10 μM) overnight. Cultured cells were harvested, washed and analyzed using flow cytometry, after staining for different markers (n = 3 mice per group). N Proportion of IRF4 + B cells; O Proportion of IL-10-producing Breg cells. P Proportion of IFNγ-CD4+ T cells. All the data were from at least two independent experiments. Q–S IRF4-sepcific siRNA knock-down abolished the differences between KO and control mice in IL-10-producing Bregs and IFNγ-producing CD4+ T cells. Splenocytes from KO and two Ctr groups (CtrCre and Ctrflox) were cultured with siRNActr or siRNAIRF4 (1μM) for 48 h. Cultured cells were harvested, washed and analyzed using flow cytometry, after staining for different markers (n = 5 mice per group). Q Proportion of IRF4+ B cells; R Proportion of IL-10-producing Breg cells. S Proportion of IFNγ-CD4+ T cells. Experiments from F to M were carried out at least twice with similar results. Experiments N to S were performed in two independent experiments with similar results. Data are presented from one of the experiments. F-M were analyzed using two-tailed Student’s t-test. N-S were analyzed using one-way ANOVA. The data are presented as mean ± SD.

