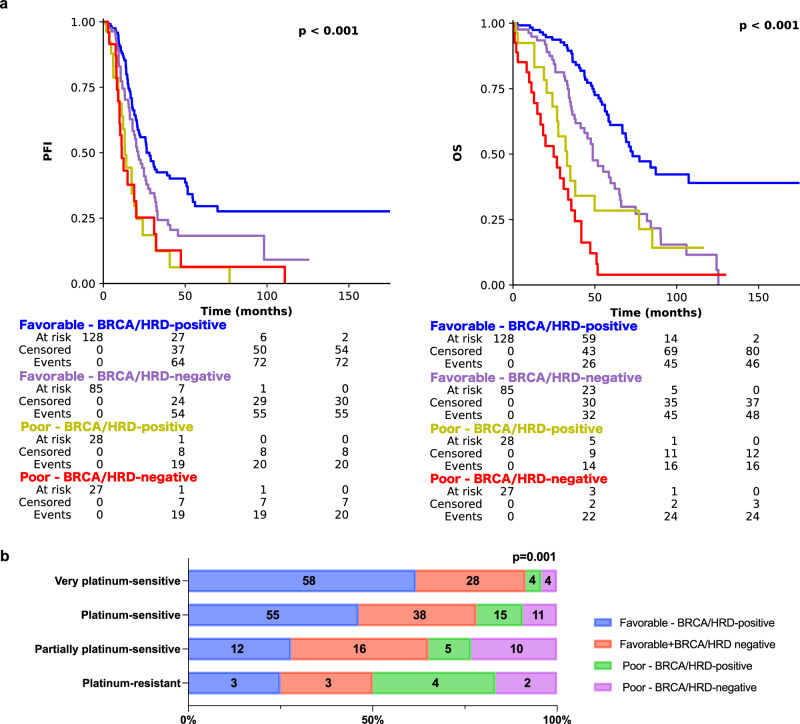
Fig. 3. Kaplan–Meier survival analyses and distribution of the true platinum-free interval groups of PathoRiCH + BRCA + HRD in the TCGA external validation cohort.
a Kaplan–Meier survival plots of patients categorized by combined PathoRiCH, BRCA, and HRD results. The combined PathoRiCH, BRCA, and HRD significantly differentiated response groups in the platinum-free interval (PFI) and overall survival (OS) (p = 1.07E-05 and p = 3.30E-16, respectively). The favorable–BRCA/HRD-positive group displayed the most favorable PFI, and the poor–BRCA/HRD-positive and poor–BRCA/HRD-negative groups showed the worst PFI. Two-sided Kaplan–Meier survival analysis was used. b Distribution of the four PFI groups (platinum resistant (PFI ≤ 6 months), partially platinum resistant (6–12 months), platinum sensitive (12–24 months), and very platinum sensitive (>24 months)) by combined PathoRiCH, BRCA, and HRD. The colored bars indicate the percentage of predictions for each outcome group (blue for favorable and red for poor), with numerical values within each bars showing the case count for each category. The combined PathoRiCH+BRCA + HRD showed significantly different distributions for the four PFI groups (p = 0.001).

