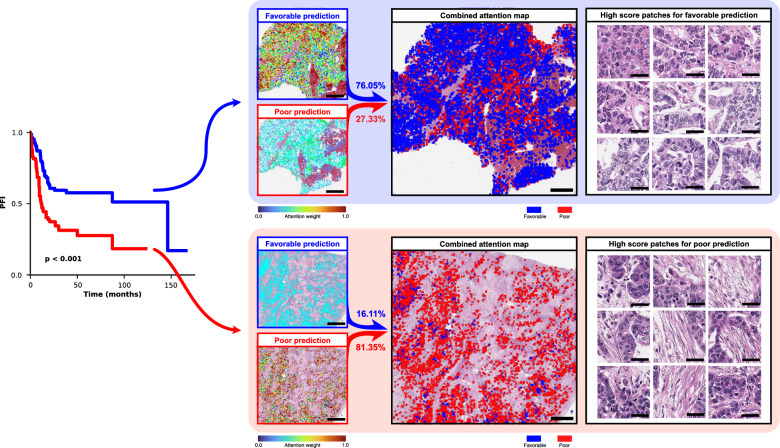
Fig. 5. Attention map analysis of the PathoRiCH-predicted favorable and poor groups.
The left side presents a two-sided Kaplan–Meier survival analysis according to PathoRiCH predictions. For these predictions, separate attention maps of favorable and poor predictions were created and then combined to generate a combined prediction attention map for each patient (scale bar = 2 mm). The figure shows two representative cases of patients from the favorable and poor groups, with the corresponding attention maps and high-score patches displayed side-by-side (scale bar = 50 µm).

