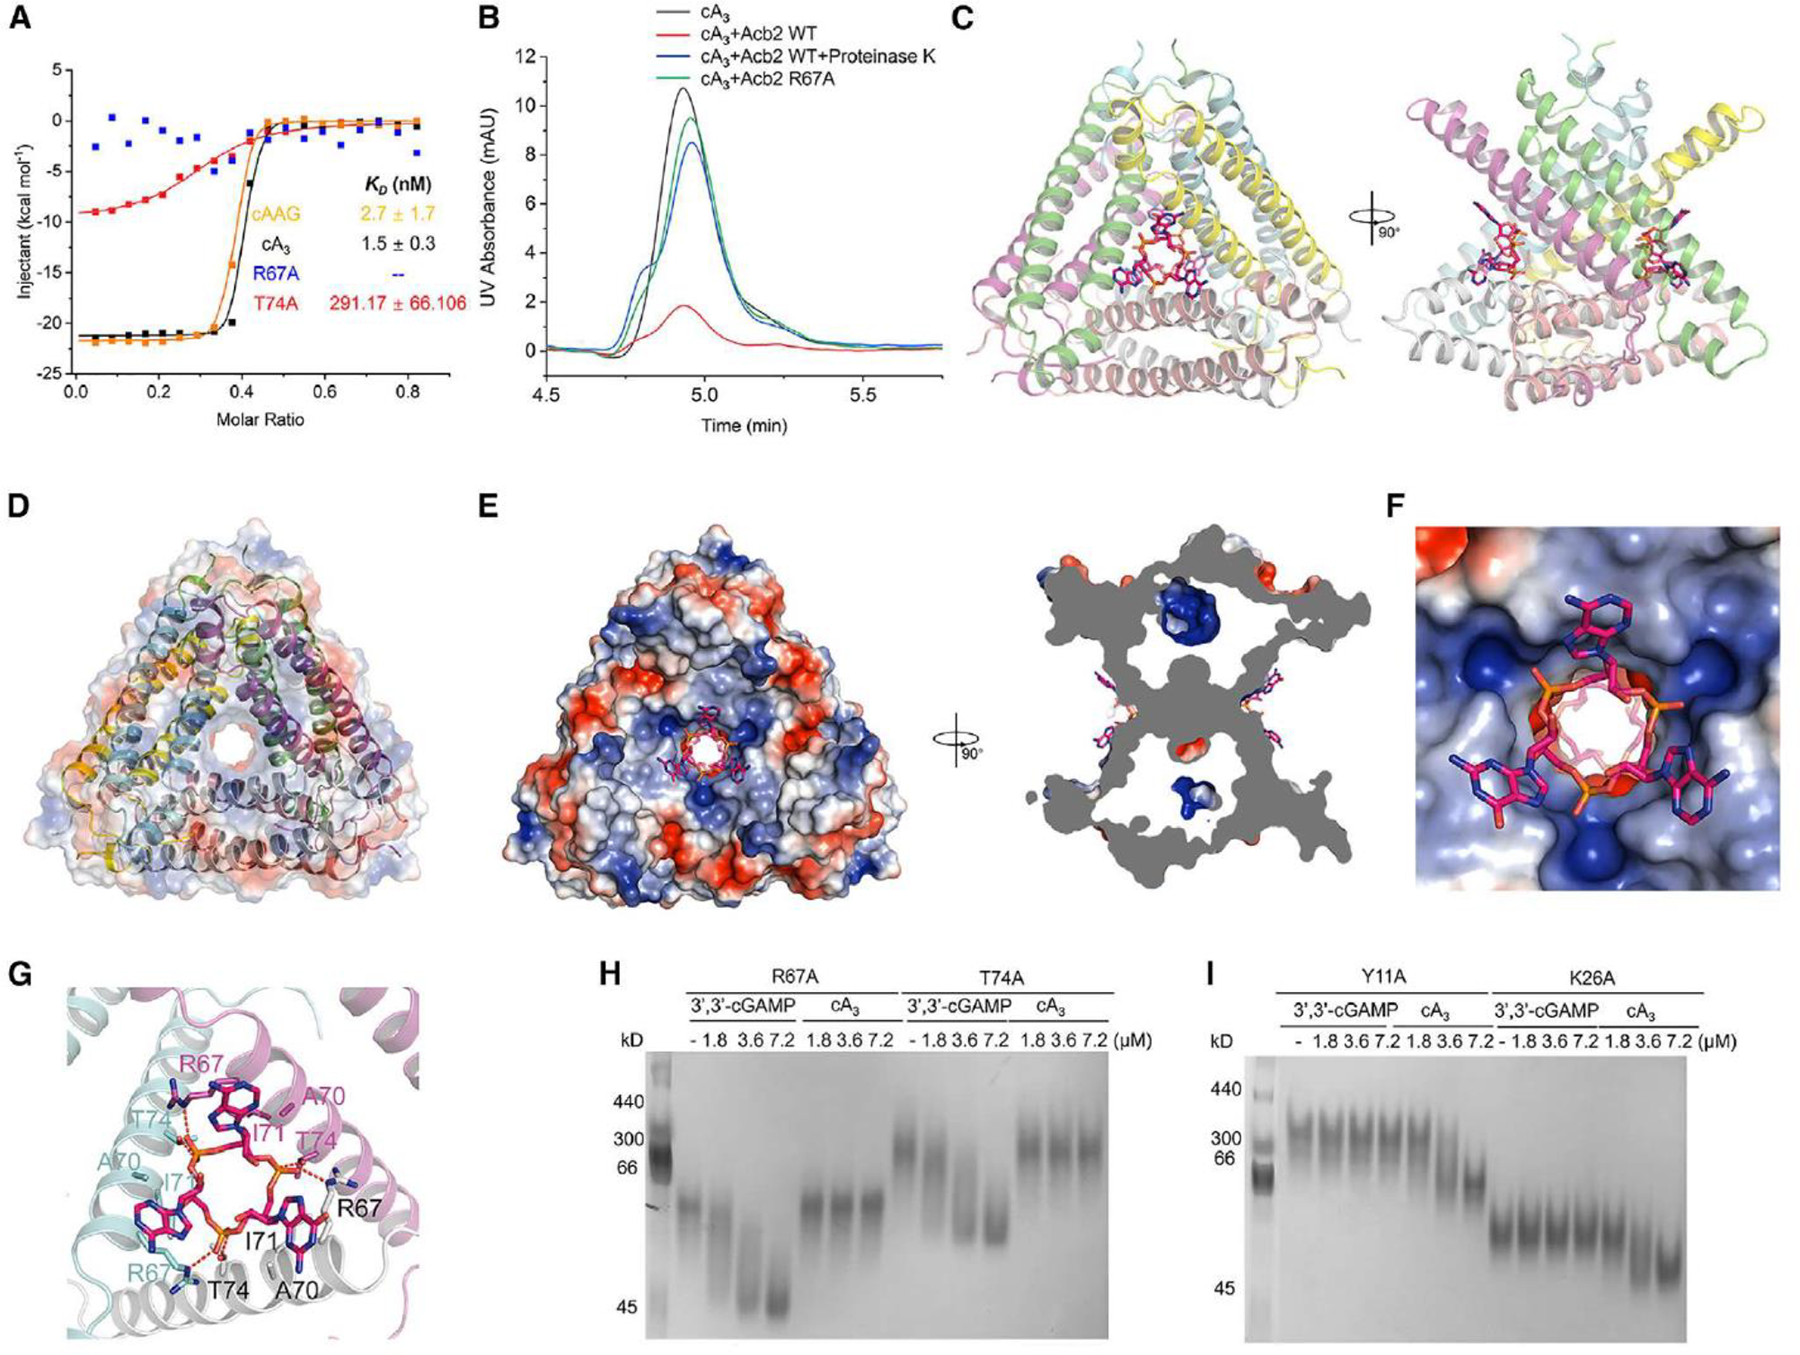
Figure 2. Acb2 binds to cyclic trinucleotides with binding sites different from those of cyclic dinucleotides.

(A) ITC assays to test the binding of cAAG and cA3 to PaMx33-Acb2, and binding of cA3 to PaMx33-Acb2 mutants. Representative binding curves and binding affinities are shown. The KD values are mean ± s.d (n = 3). Raw data for these curves are shown in Figure S2. The two mutants R67A and T74A in the panel represent their binding to cA3.
(B) The ability of PaMx33-Acb2 to bind and release cA3 when treated with proteinase K was analyzed by HPLC. cA3 standard was used as a control. The remaining cA3 after incubation with PaMx33-Acb2 was tested.
I Overall structure of Acb2 complexed with cAAG, which are shown as sticks. Two views are shown.
(D) Electrostatic surface of Acb2 overlaid on the cartoon model shows the channel in the center of the Acb2 hexamer.
I Electrostatic surface of Acb2 bound with cAAG. Two views are shown.
(F) A closer view of the binding pocket shown in the left panel of D.
(G) Detailed binding between Acb2 and cAAG. Residues involved in cAAG binding are shown as sticks. Red dashed lines represent polar interactions.
(H-I) Native PAGE showed the binding of PaMx33 Acb2 mutants to cyclic oligonucleotides.
