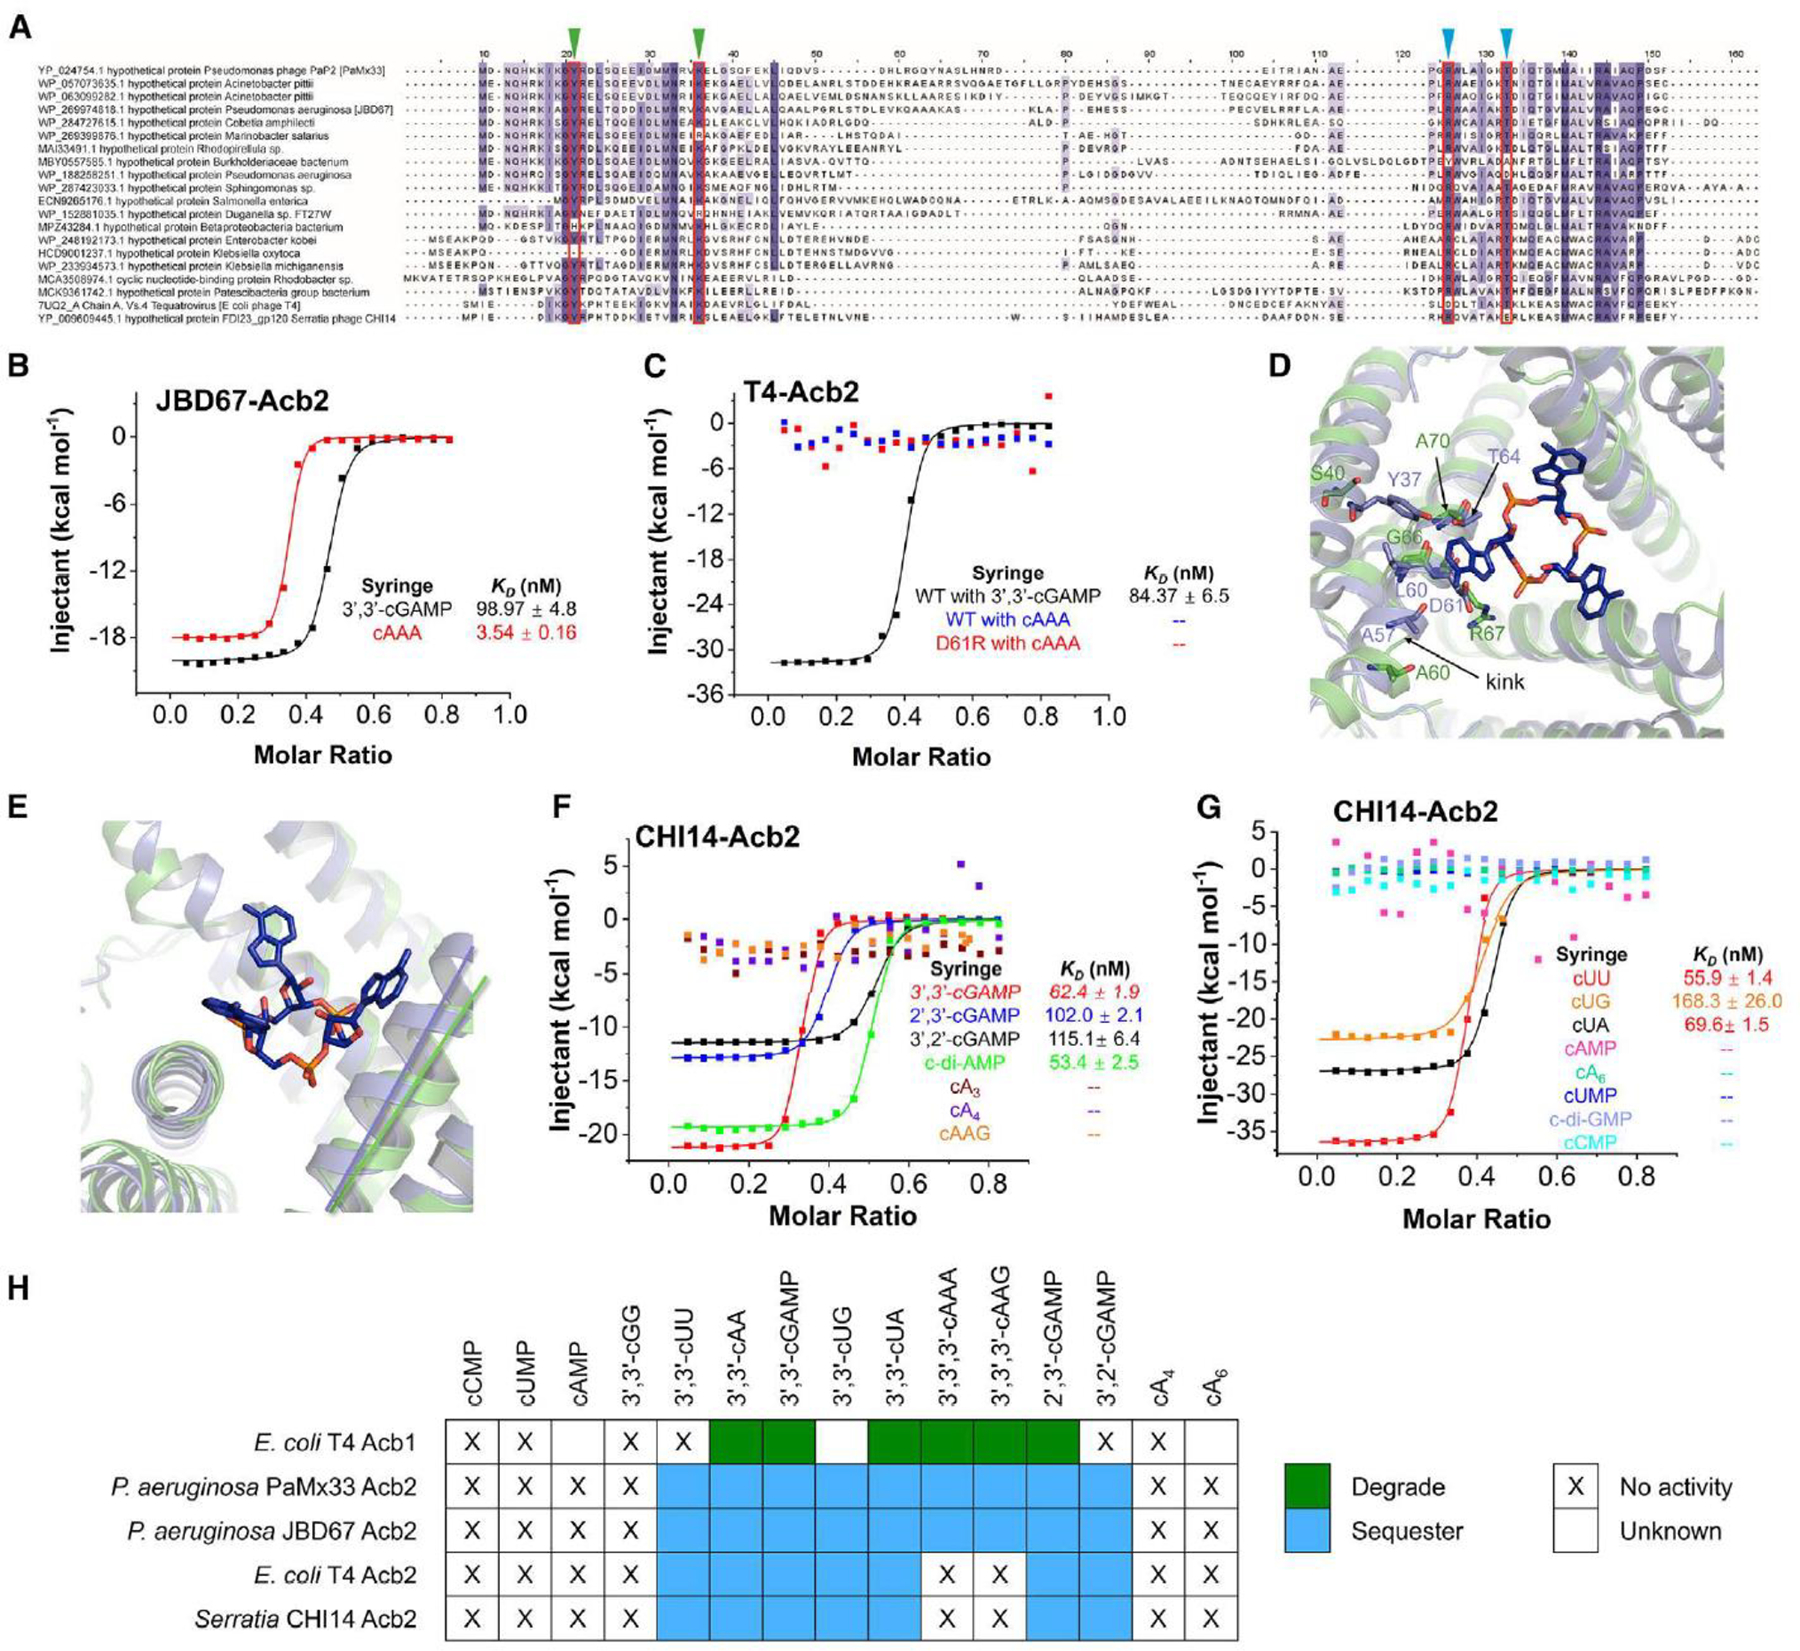
Figure 4. The binding spectra are different among Acb2 homologs.

(A) Sequence alignment among Acb2 homologs. Residues that are >80 % conserved, >60 % conserved and >40% conserved are shaded in dark purple, light purple, and light grey, respectively. Residues involved in binding of cyclic CDNs and CTNs are marked with green and blue triangles, respectively.
(B) ITC assays to test binding of cyclic oligonucleotides to JBD67-Acb2. Representative binding curves and binding affinities are shown. The KD values are mean ± s.d. (n=3). Raw data for these curves are shown in Figure S7.
(C) ITC assays to test binding of cyclic oligonucleotides to T4-Acb2. Representative binding curves and binding affinities are shown. The KD values are mean ± s.d. (n=3). Raw data for these curves are shown in Figure S7.
(D) Structural alignment between PaMx33-Acb2 and T4-Acb2 at one monomer. Residues with potential steric clash with cA3 in T4-Acb2 and the corresponding residues in PaMx33-Acb2 are shown in sticks.
(E) The same alignment shown in (D), highlighting the different relative angels formed by the three helices lining the binding pocket of cA3.
(F-G) ITC assays to test binding of cyclic nucleotides to CHI14-Acb2. Representative binding curves and binding affinities are shown. The KD values are mean ± s.d. (n=3). Raw data for these curves are shown in Figure S9.
(H) Summary of the binding results of Acb2 homologs and Acb1. 15
