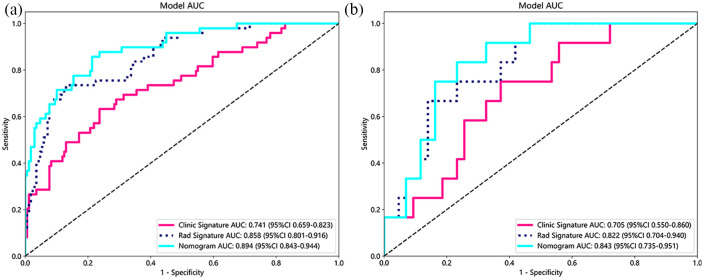
Figure 9.
(a) The AUC of clinic signature, rad signature, and nomogram in train cohorts. (b) The AUC of clinic signature, rad signature, and nomogram in test cohorts. The combined model surpasses the clinical and radiomics models in both the train and test cohorts for the predictive performance regarding the micropapillary and solid components of lung adenocarcinoma.
AUC, area under the curve.

