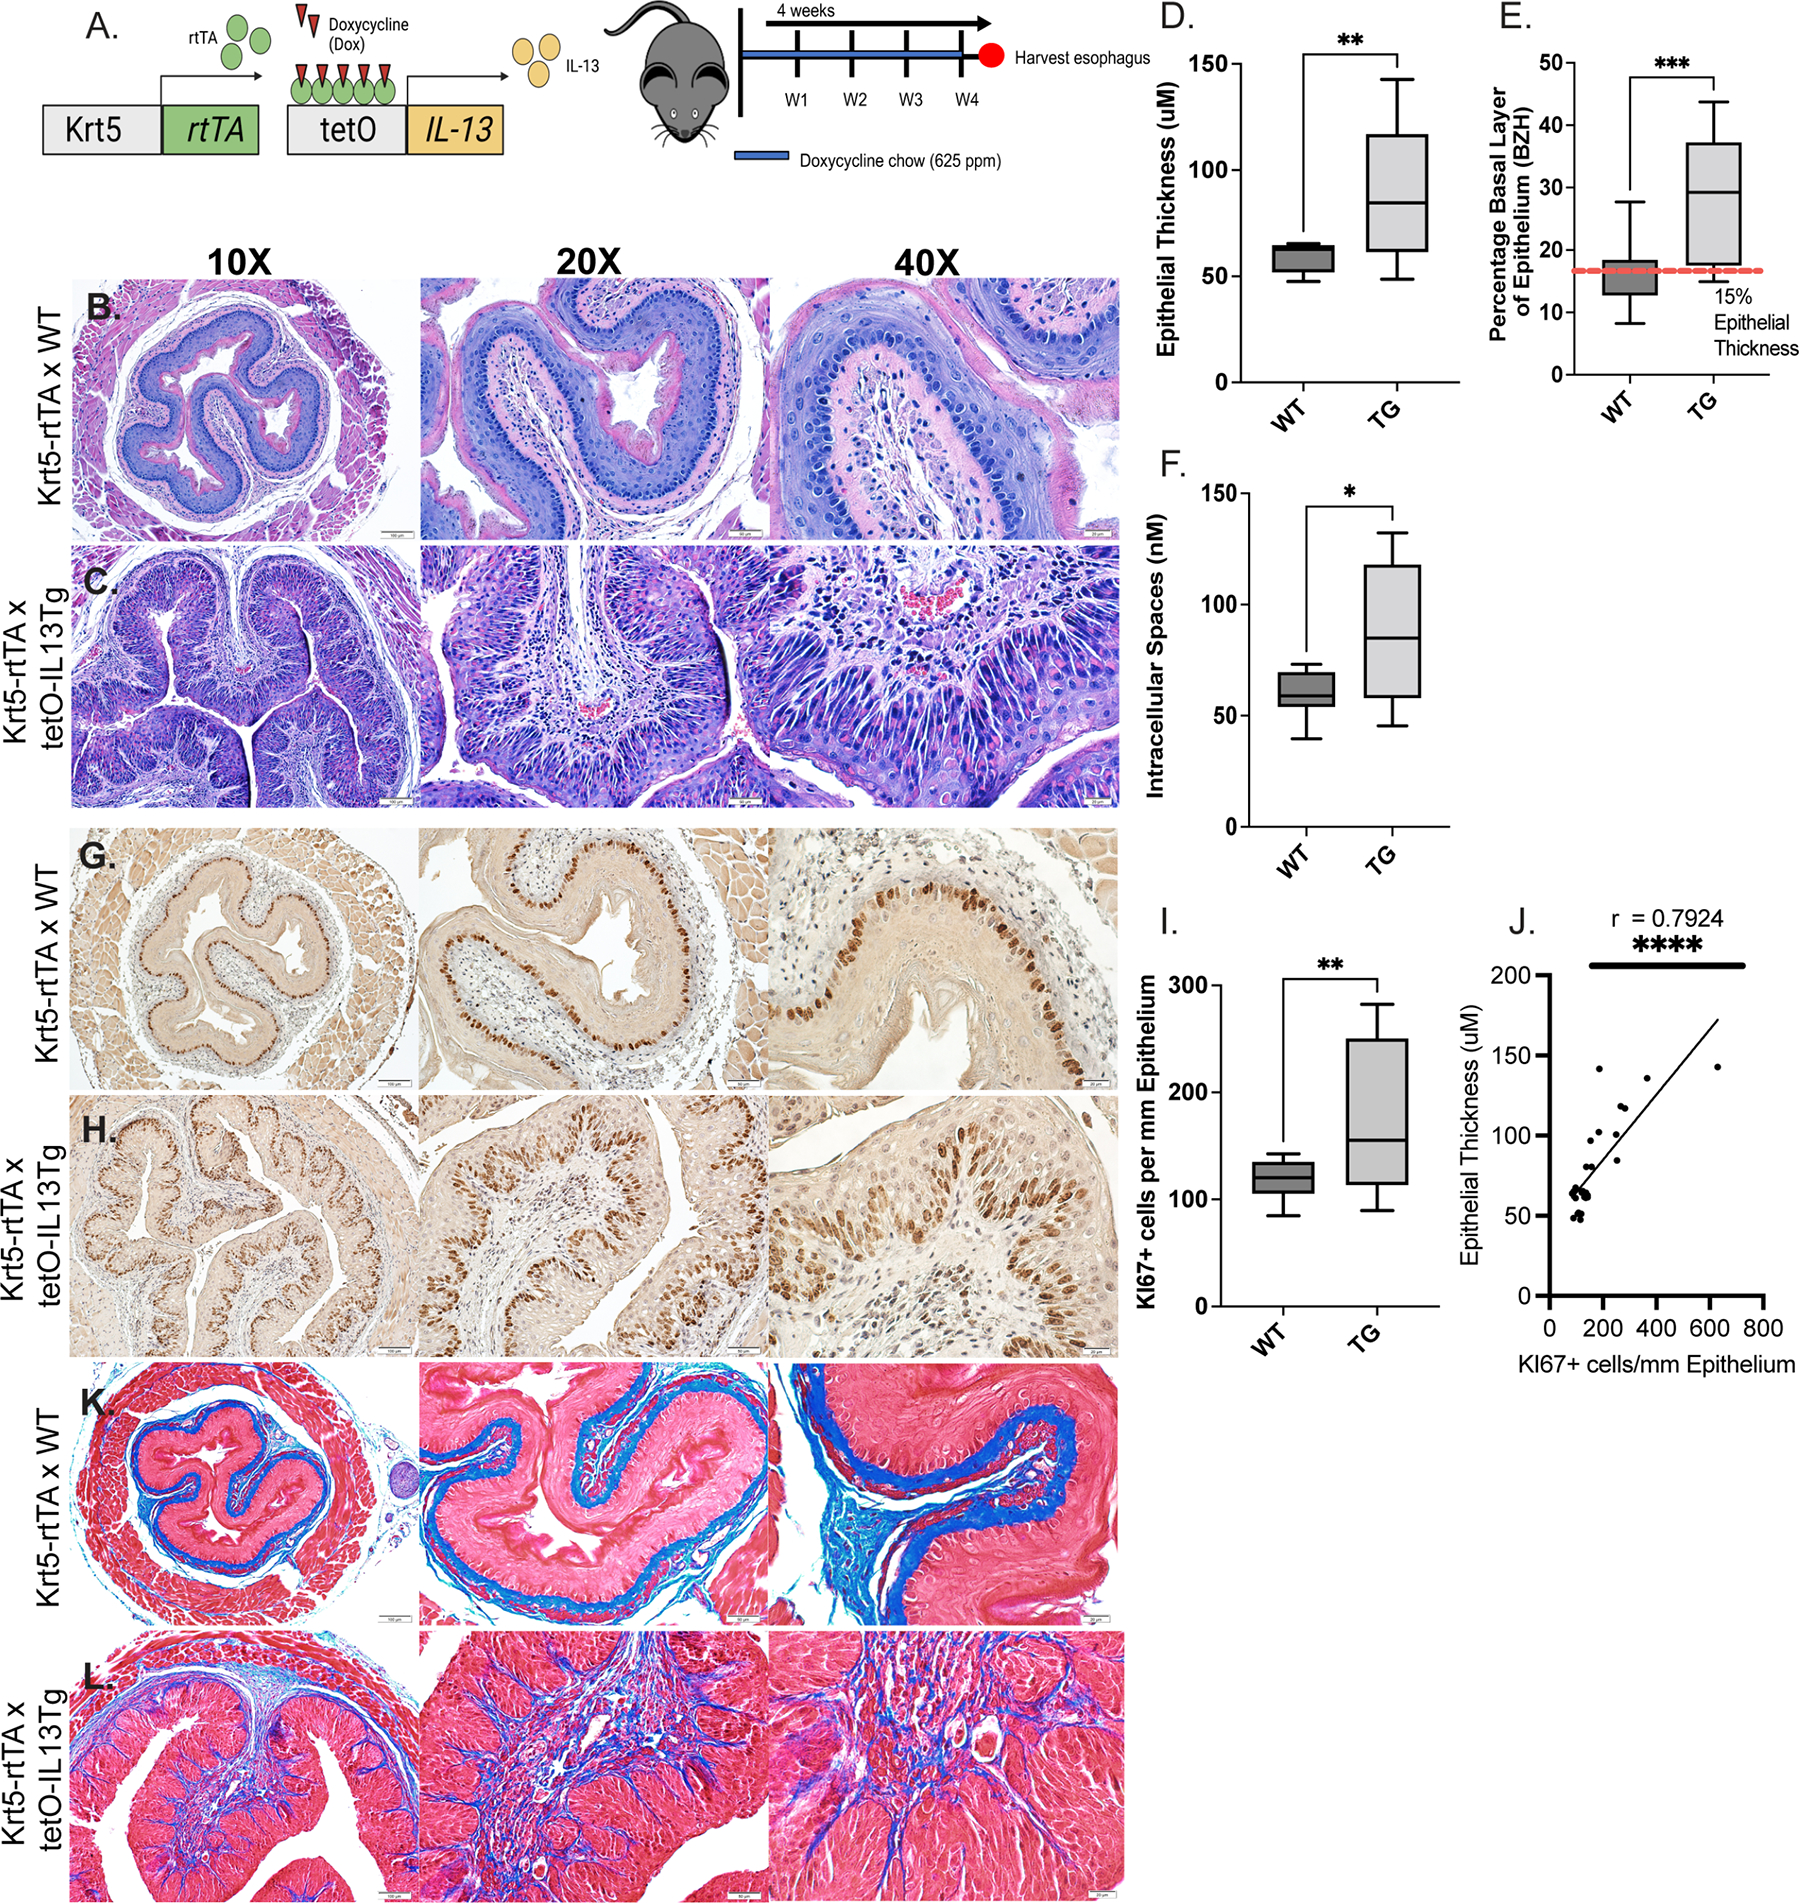
Figure 3:

Mice with inducible overexpression of IL-13 in esophageal epithelial cells exhibit epithelial remodeling and increased STAT3 expression. A. Schematic of in vivo model of IL-13-induced esophageal epithelial remodeling B-C. H&E staining of Dox+ Krt5-rtTA x WT (WT) and Dox+ Krt5-rtTA xTetO-IL-13Tg (Tg) mouse esophagus; yellow arrows indicate DIS, green bars indicate BZH and red bars indicate total epithelial thickness D-E. Immunohistochemistry (IHC) staining for Ki67 for esophageal basal proliferation of WT and Tg esophagus; green arrows indicate Ki67+ cells F-G. Masson’s Trichrome staining for collagen deposition in WT and Tg mice H. Measurement of total epithelial thickness I. Percentage of basal zone to total epithelial thickness J. Measurement of dilated intercellular spaces (nM) K. Quantification of Ki67+ cells/mm epithelium L. Spearman correlation analysis between Ki67+ cells/mm epithelium and esophageal epithelial thickness in WT and Tg mice. Individual data points represent 1 mouse. Welch’s t tests were performed to compare differences in quantifications of epithelial thickness, percent basal zone, dilated intercellular spaces, and Ki67+ cells / mm epithelium between WT and Tg mice. * p < .05, ** p < 0.01, *** p < 0.001, **** p < 0.0001. Data represented as means ± SEMs of three independent experiments.
