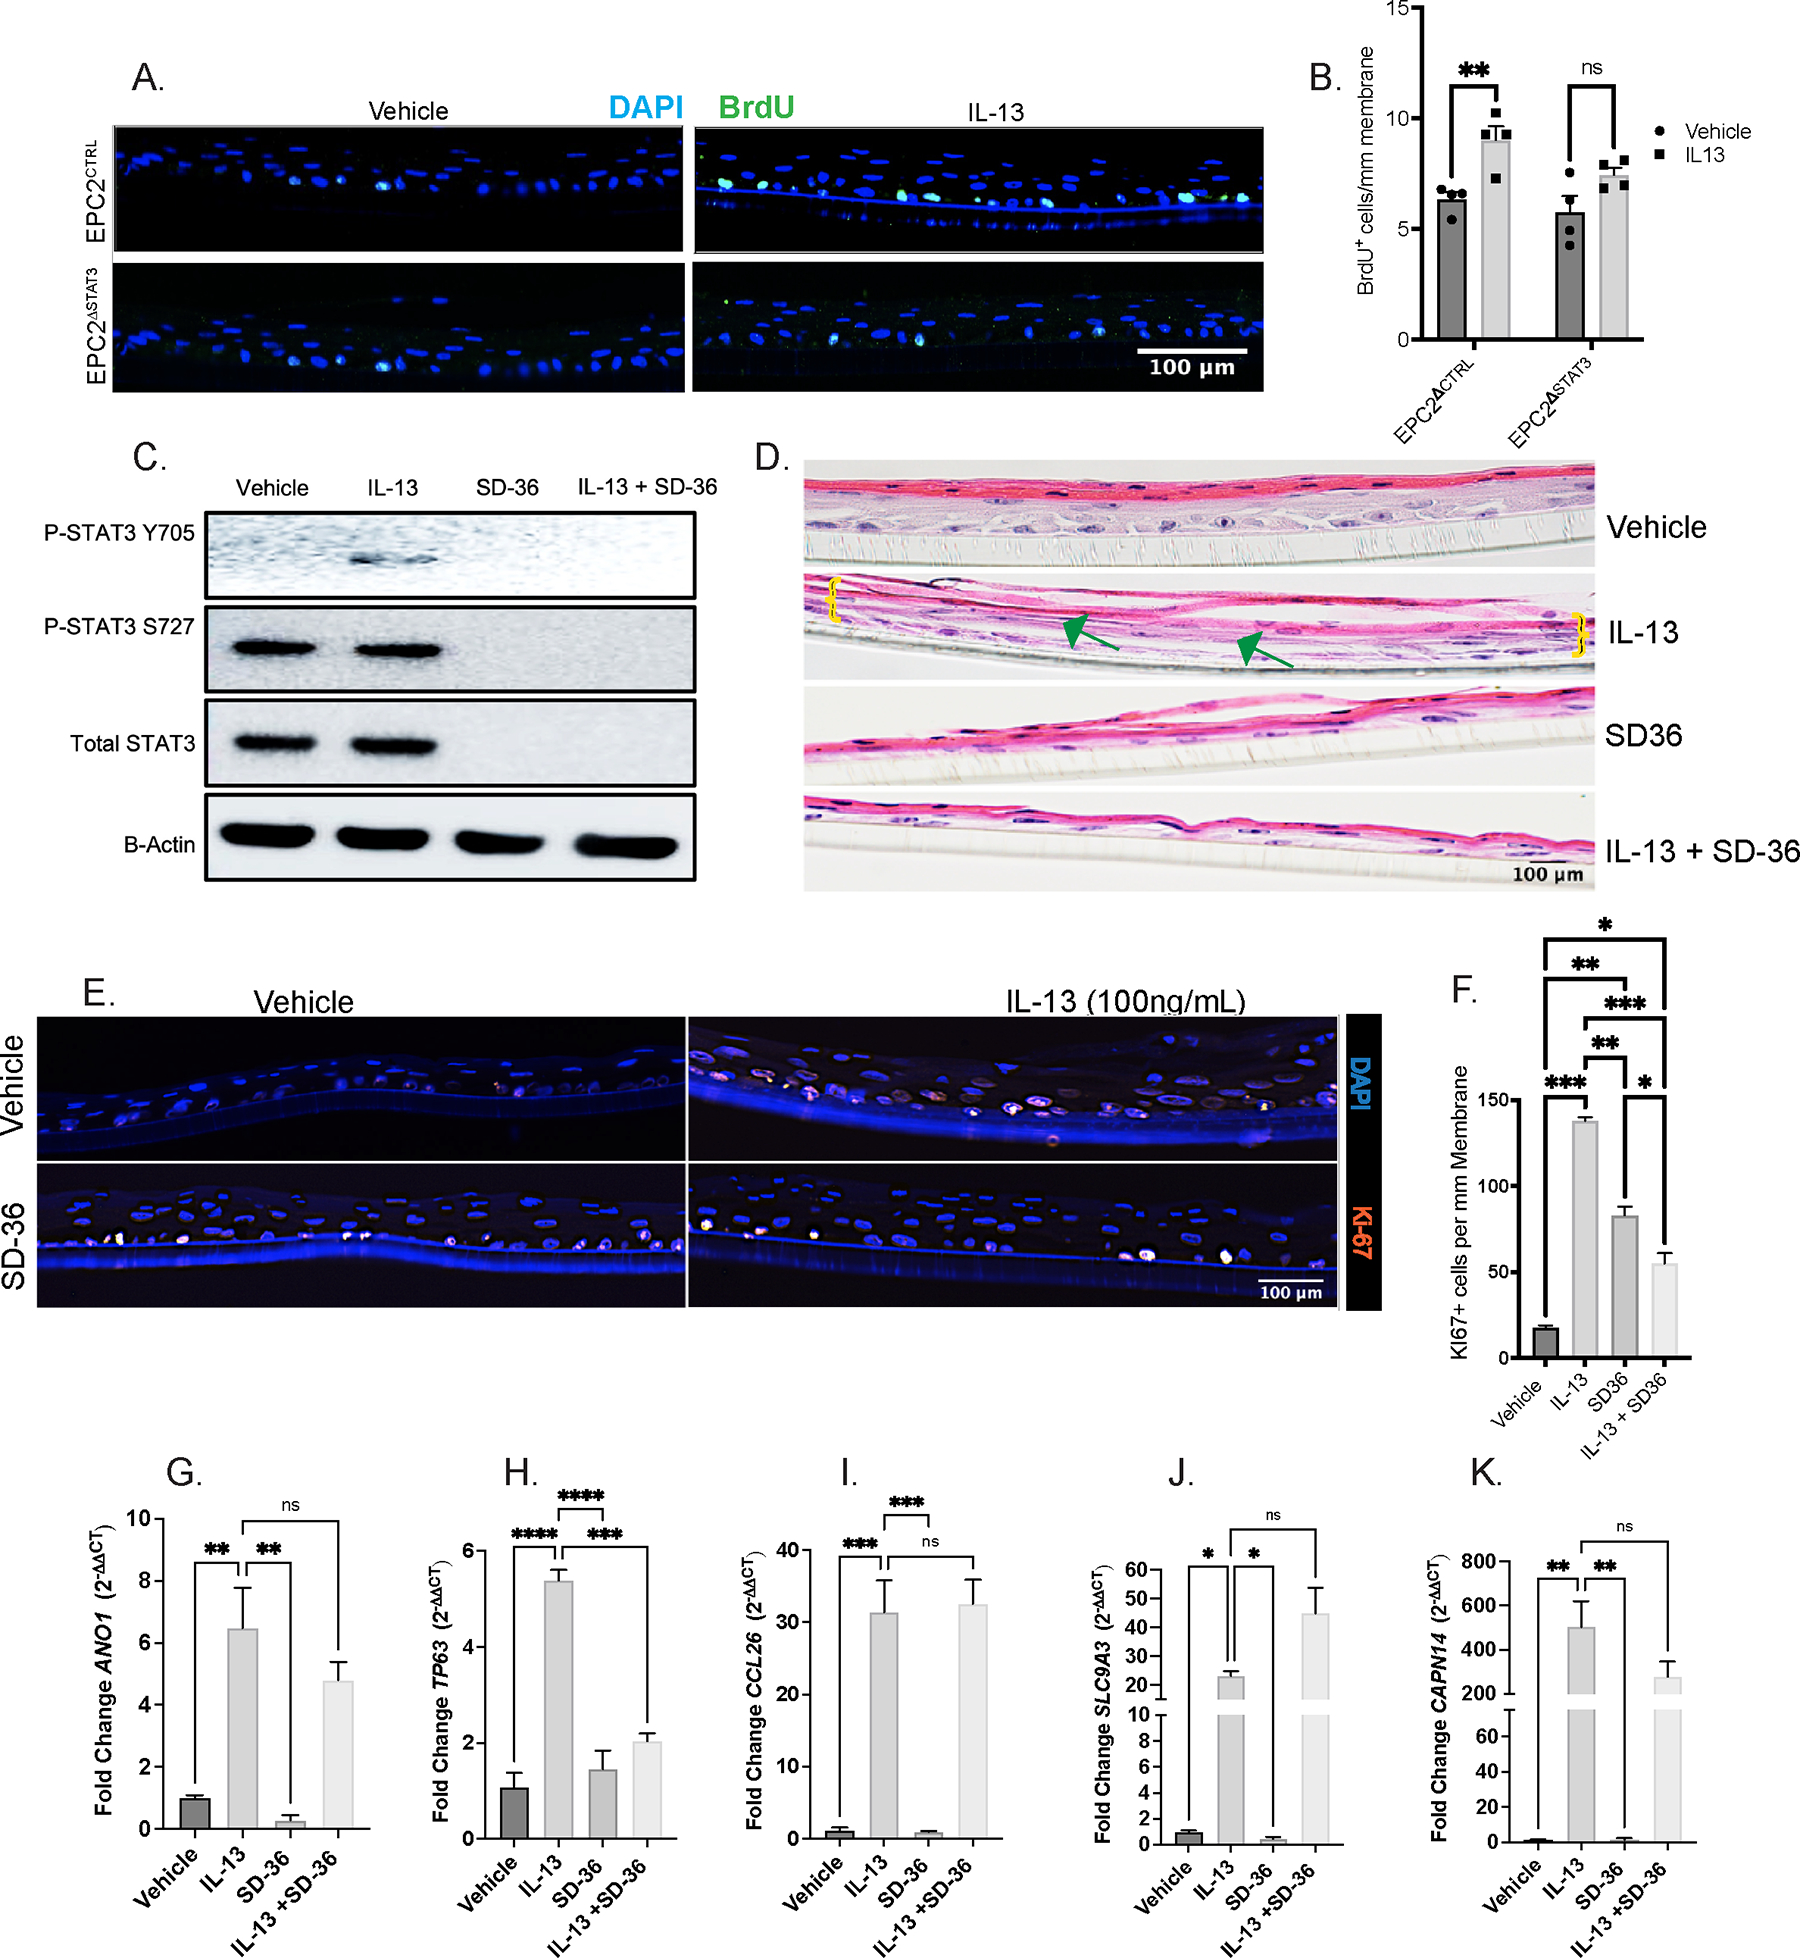
Figure 5:

IL-13-induced esophageal epithelial proliferation requires STAT3. A. Immunofluorescence staining of Brdu (green) and DAPI of EPC2CTRL and EPC2ΔSTAT3 cells under Vehicle and IL-13 stimulation B. Quantification of Brdu+ cells/mm membrane C. Western blot of EPC2-ALI probing for total (STAT3), phosphorylated STAT3 (pSTAT3-Y705 and pSTAT3-S727), and total STAT6 (STAT6) in the presence and absence of IL-13 and selective STAT3 degrader, SD-36 D. Hematoxylin & Eosin staining showing epithelial remodeling (BZH, DIS) in EPC2-ALI in the presence and absence of IL-13 and SD-36; green arrow points to DIS and yellow brackets mark basal cell expansion E. IF staining for Ki67 (red) for basal cell proliferation and DAPI (blue) in EPC2-ALI in the presence and absence of IL-13 and SD-36 F. Quantification of Ki67+ cells/mm membrane G-K. qPCR for mRNA fold-change of ANO1, TP63, CCL26, SLC9A3, and CAPN14, respectively, in the presence and absence of IL-13 and SD-36. Ordinary one-way ANOVA with Tukey’s multiple comparisons test were performed on qPCR analyses and quantification of Brdu+ cells/mm membrane of the mean fold-change expression values across groups. Data represented as means ± SEMs of three independent experiments, with n = 3 samples per group. * p < .05, ** p < 0.01, *** p < 0.001, **** p < 0.0001.
