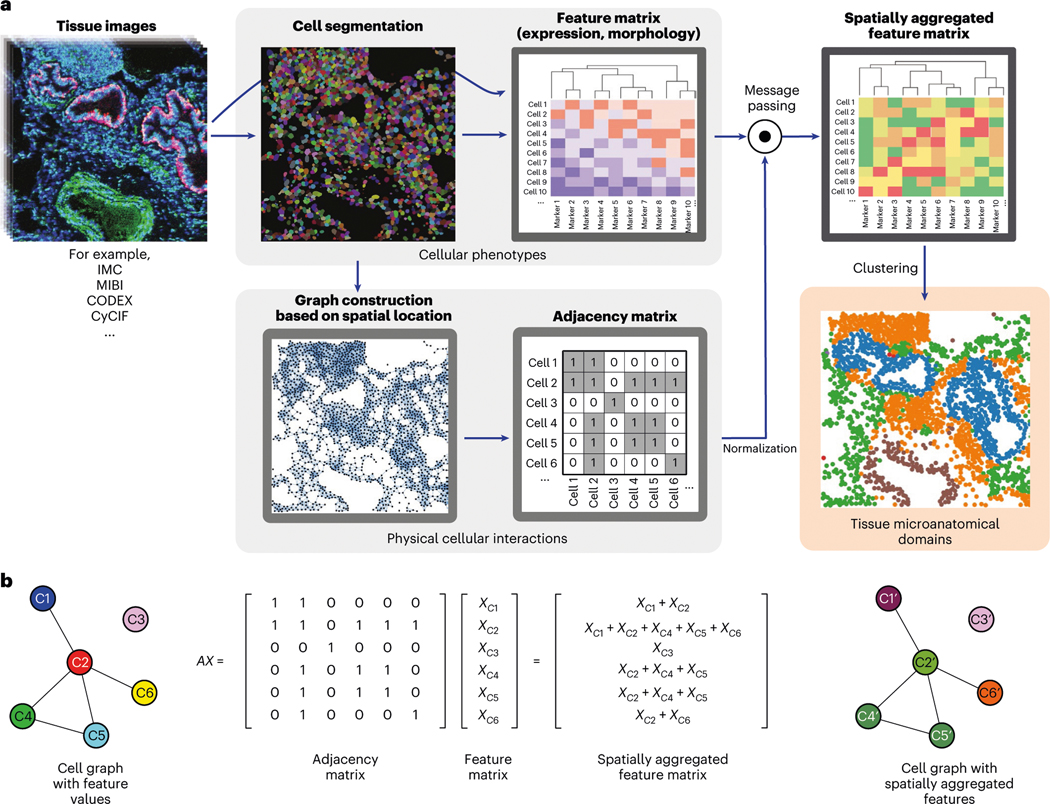
Fig. 1 |. Unsupervised discovery of tissue architecture with graphs.

a, Schematic description of the methodology for the discovery of domains of tissue microanatomy and architecture using graphs of cellular interactions. Intensity values and cellular segmentation masks are used to derive an expression matrix containing the intensity of each marker in each cell and a graph of physical cellular interaction based on proximity, which can be represented as a binary adjacency matrix. Message passing (described in b) combines the expression and adjacency matrices into a new matrix of spatially aggregated expression values which serves as the input for clustering methods. The resulting clusters represent domains of tissue microanatomy underlying the tissue architecture. The procedure can be performed jointly across several images, yielding consistent microanatomical domains across images. b, Graphical description of the message passing procedure, in which the adjacency and expression matrices are combined with the dot product. Note how in the message-passed graph, the node colors are linear combinations of the colors of the nodes with which they share edges. Each element in the feature matrix in this example depicts a vector of features.
