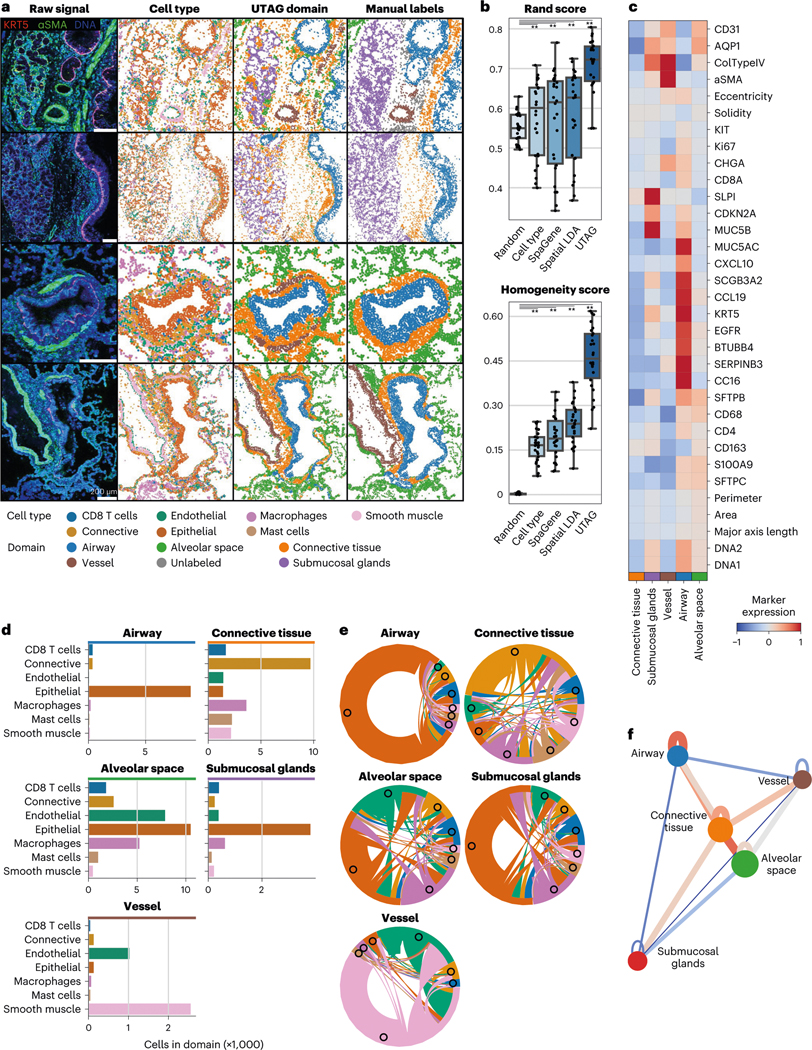
Fig. 2 |. Discovery of microanatomical domains and principles of tissue architecture in human lung.

a, Microanatomical domains detected in IMC images of healthy human lung tissue. The first column illustrates the intensity of three selected channels in four representative images; the second column, the cell identity of the cells in those images; the third column displays the microanatomical domains discovered with UTAG; and the fourth column displays the microanatomical domains manually annotated by experts. Scale bars, 200 μm. b, Benchmarking of UTAG and competing methods against expert annotation. n = 26 highly multiplexed IMC lung images from three donor specimens. For a baseline comparison, we include randomized domain labels per cell and cell type identities. Each point represents one image and for both metrics values closer to 1 are optimal.** P < 0.0001, two-sided Mann-Whitney U-test after Benjamini-Hochberg P-value correction. Data in boxplots are presented by minimum, 25th percentile, median, 75th percentile and maximum. Values outside of 1.5 times interquartile range are classified as outliers and are denoted as fliers. c, Mean channel intensity for all channels aggregated by the discovered microanatomical domains. d, Cellular composition of microanatomical domains. e, Composition of microanatomical domains in terms of intercellular interactions derived from physical proximity. f, Model of physical proximity between microanatomical domains in the lung. The nodes of the graph represent the microanatomical domains, and the color of the edges between them show the strength and direction of their physical interactions. The node position is determined based on the edge weight using the Spring force-directed algorithm.
