
Fig. 4 |. Discovery of microanatomical domains associated in cancer.
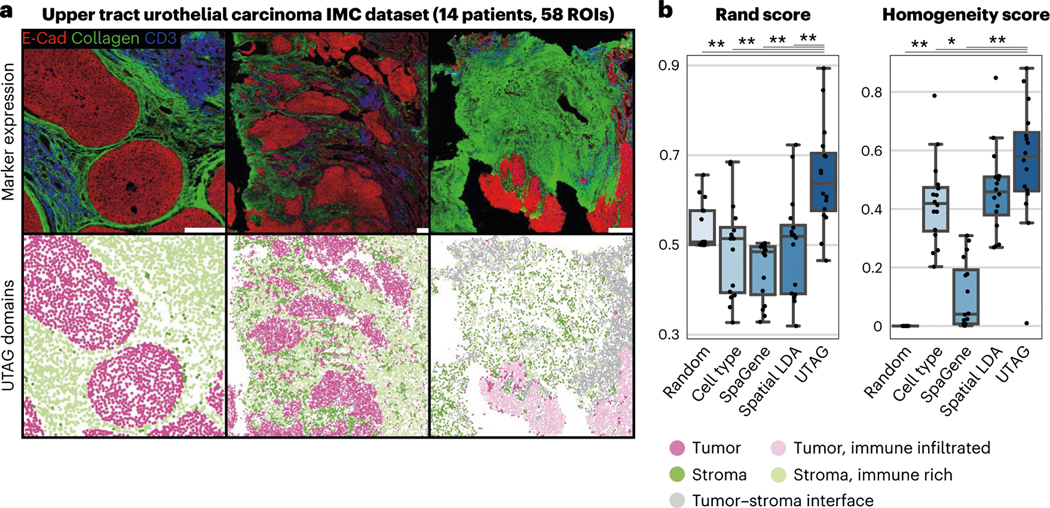
a, Discovery of tumor and stromal domains in IMC images of UTUC. The top row illustrates the intensity of three selected channels and the bottom row displays the UTAG domains. Scale bars, 200 μm. b, Benchmark of the UTAG domains against manual annotation of tumor and stromal domains. For comparison, we include randomized domain labels per cell and cell type identities. Each point represents one image and for both metrics values closer to 1 are optimal. n = 16 highly multiplexed IMC images with manually annotated microanatomical domains. Data in boxplots are presented by minimum, 25th percentile, median, 75th percentile and maximum. Values outside of 1.5 times interquartile range are classified as outliers and are denoted as fliers. **P < 0.01, *P < 0.05, two-sided Mann-Whitney U-test, Benjamini-Hochberg adjusted.