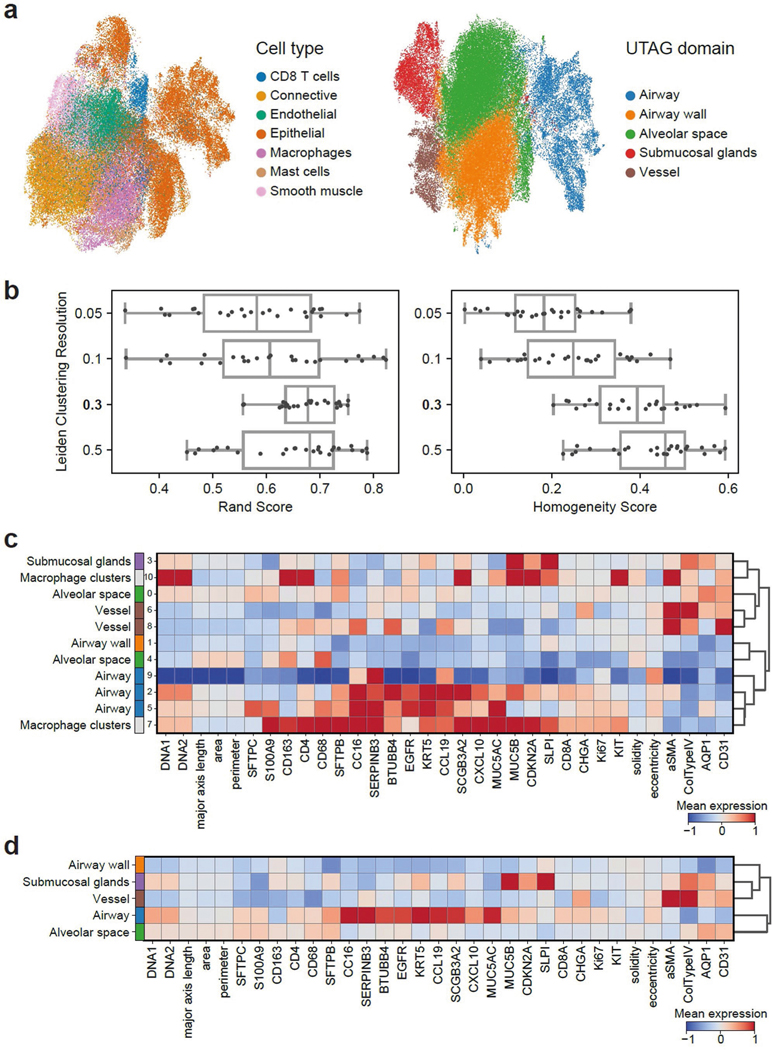
Extended Data Fig. 1 |. UTAG analysis of IMC images of healthy lung.

a) UMAP representation of all cells across all images based on cellular phenotypes only (left), or cellular phenotypes and positional information combined with UTAG (right). b) Labeling of domains from clustering indices. Leiden clustering at resolution 0.3 was mapped to domains based on expression profiles as it performed well on both Rand and Homogeneity score. Data in boxplots are presented by minimum, 25th percentile, median, 75th percentile, and maximum. **p < 0.01,,*p < 0.05, two-sided Mann-Whitney-U test Benjamini-Hochberg adjusted. c) Deciding optimal resolution for healthy lung IMC data. Leiden clustering for resolution of 0.1 was selected as the ideal resolution because it had the greatest median rand score across all slides.
