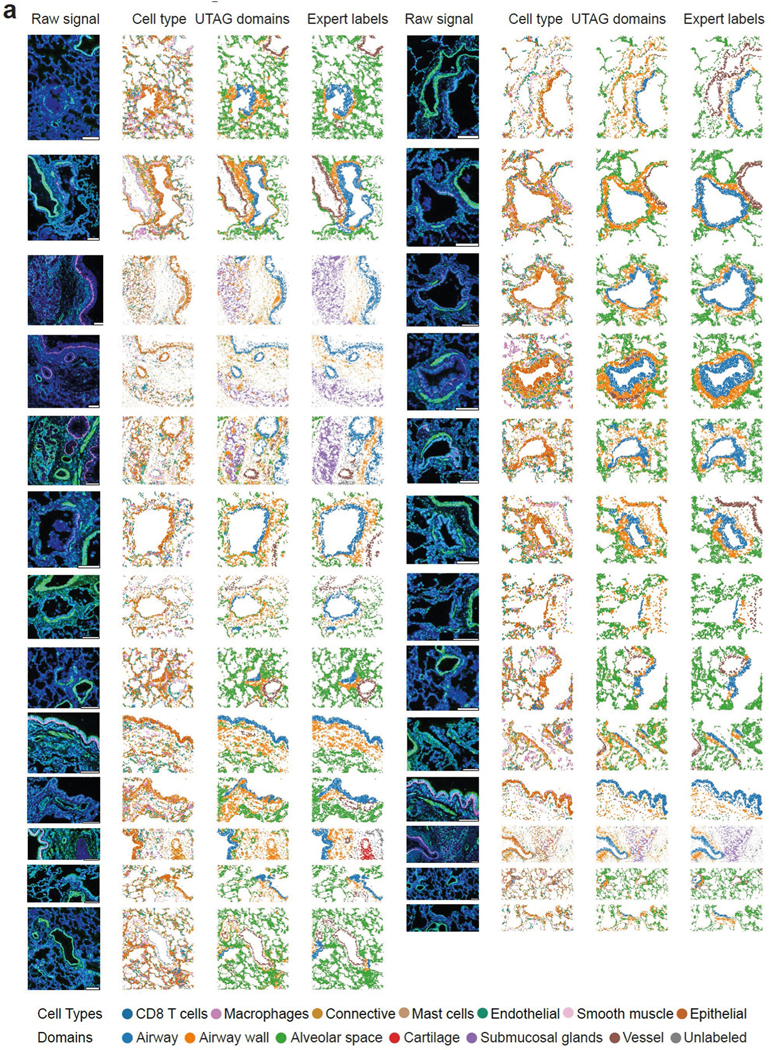
Extended Data Fig. 2 |. Illustration of UTAG results on IMC images of healthy lung.

a) Illustration of lung IMC images where the first column illustrates three channels (KRT5, aαSMA, DNA), the second column cell type identities, the third column cells colored by manual annotation of microanatomical domains, and the fourth column cells colored by UTAG domains. Each channel on the raw signal is keratin 5 for red, alpha smooth muscle for green, and DNA for blue. Scale bars represent 200 μm.
