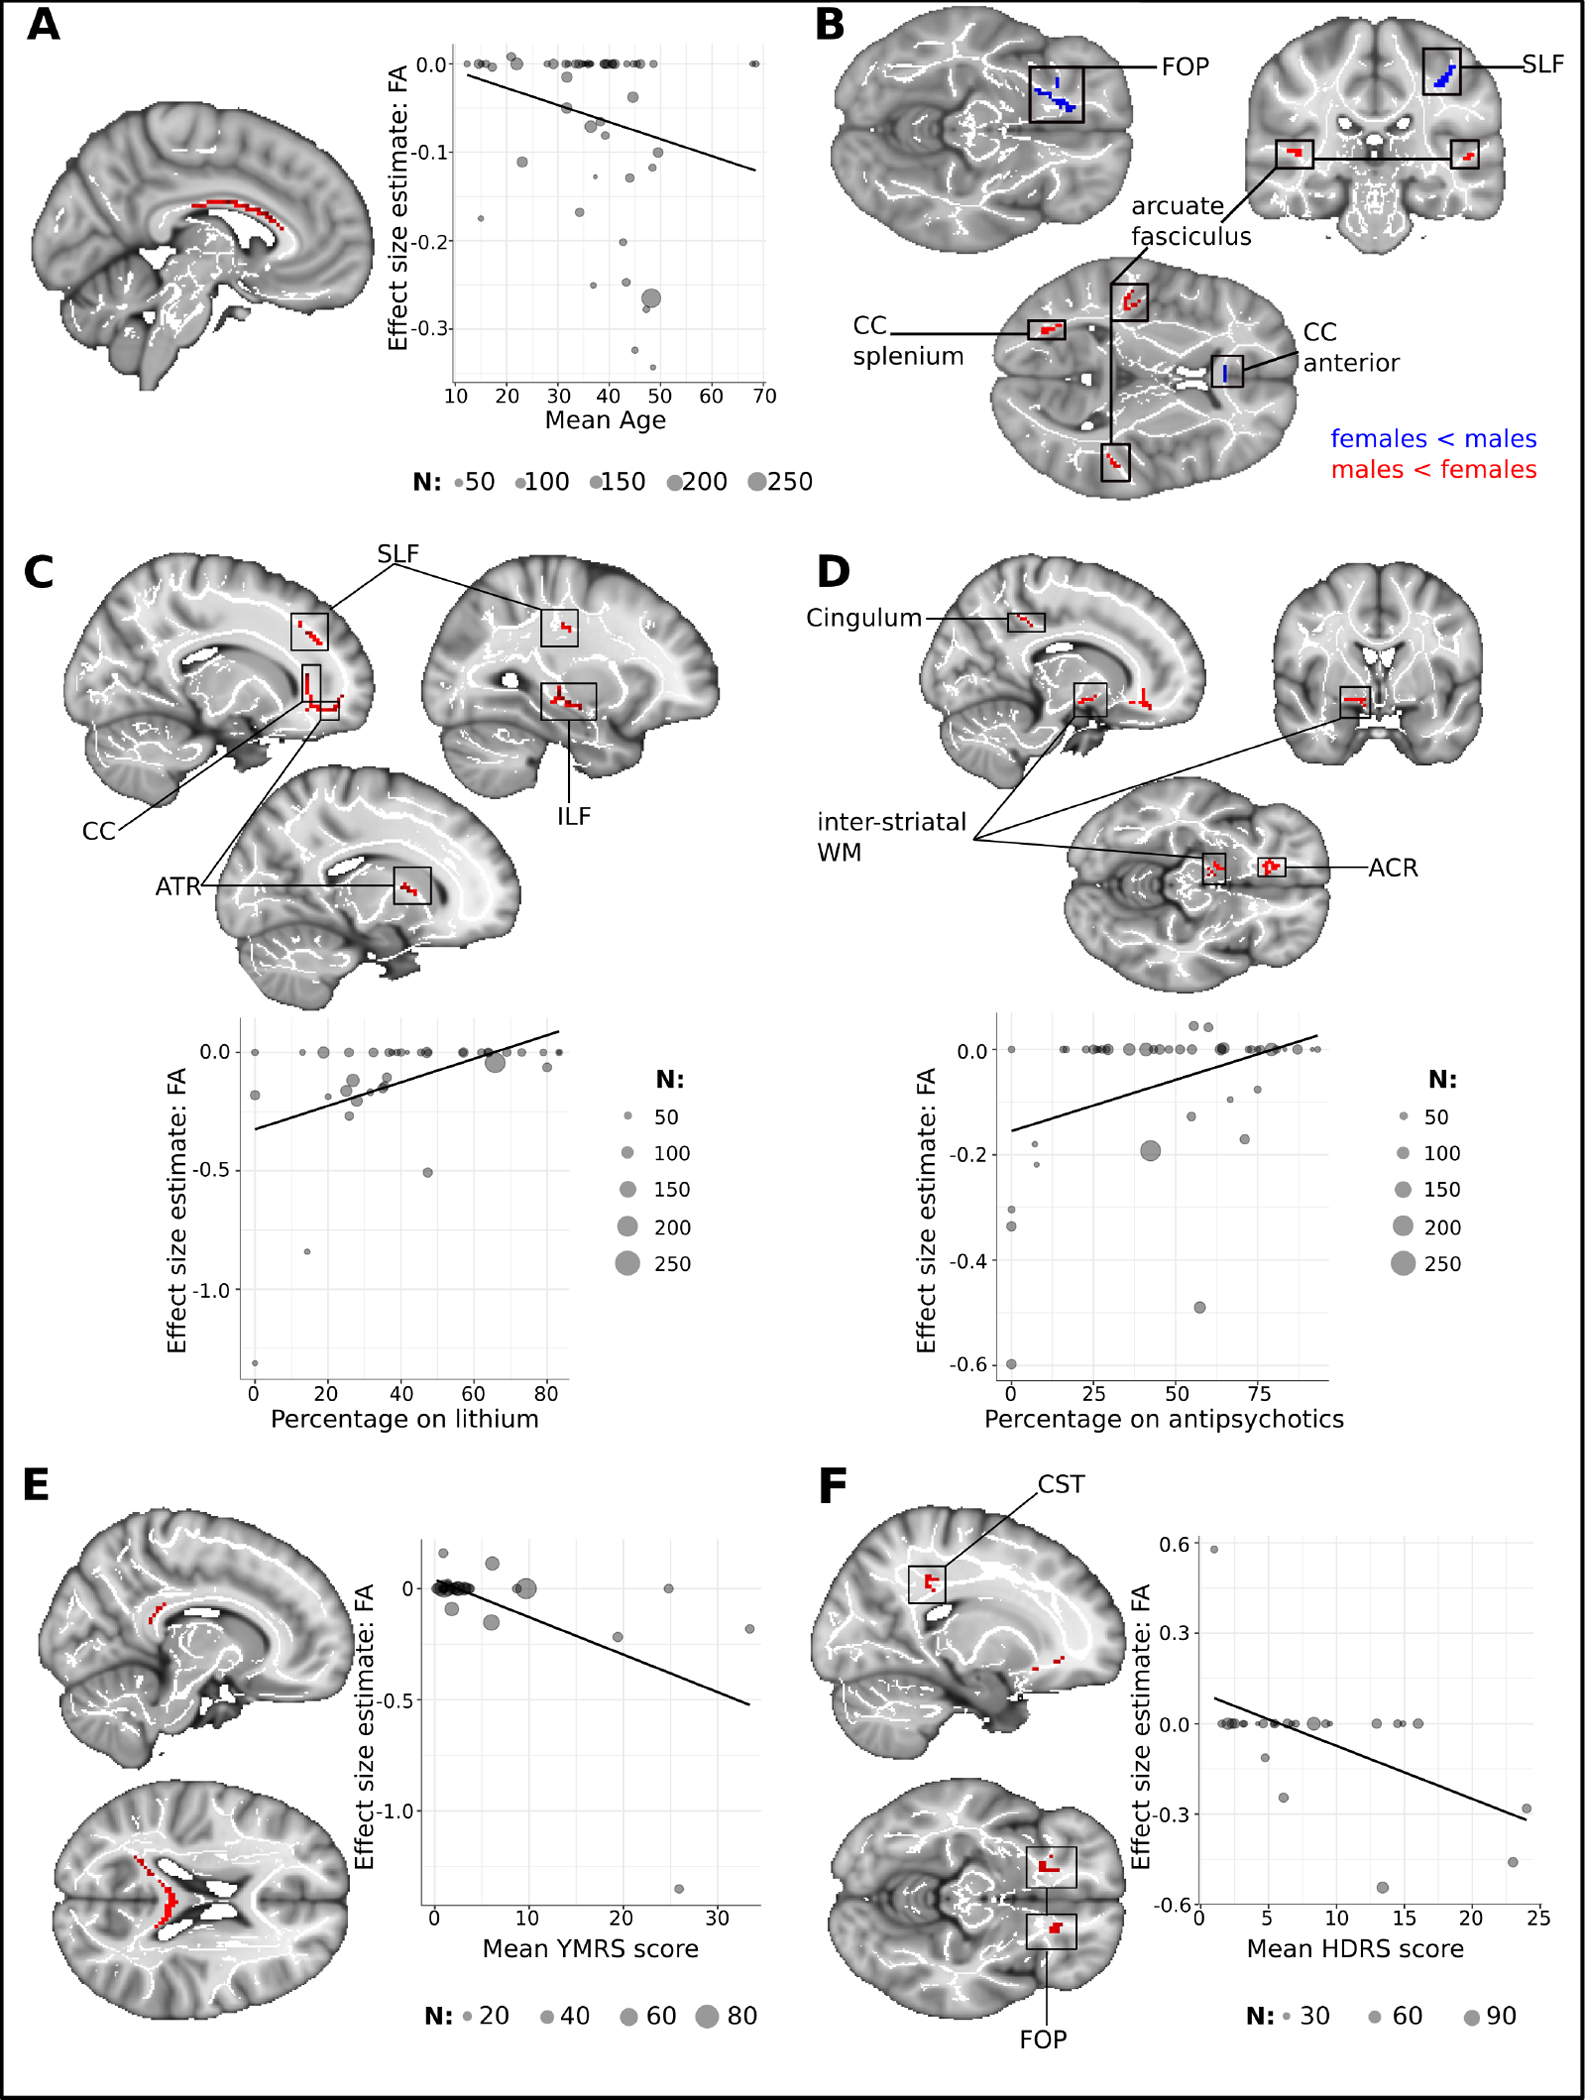
Figure 2. Illustration of meta-regression findings regarding age, medication status, and current mood in individuals with bipolar disorder.

(A) Shows the cluster of age-related FA increases in the corpus callosum. Estimates of regional FA were extracted from the peak voxel coordinates (x = −6, y = −14, z = 26) (B) Depiction of the sex effect in BD (C) Positive lithium effect on FA. FA-values shown in the scatterplot were extracted from the largest cluster in the anterior thalamic radiation (x = 20, y = 38, z = −6). (D) Positive effect of antipsychotics on FA, FA-values were extracted from the peak voxel of the cluster in the ACR (x = 14, y = 28, z = −12) (E) Cluster showing FA decreases related to manic symptoms in the splenium of the CC (F) Clusters of decreased FA associated with depressed mood. FA-values were extracted from the CST-cluster (x = 26, y = −22, z = 36). N indicates the number of individuals with BD in the studies.
Abbreviations: ACR, anterior corona radiata; ATR, anterior thalamic radiation; CST, corticospinal tract; ILF, inferior longitudinal fasciculus; SLF, superior longitudinal fasciculus
