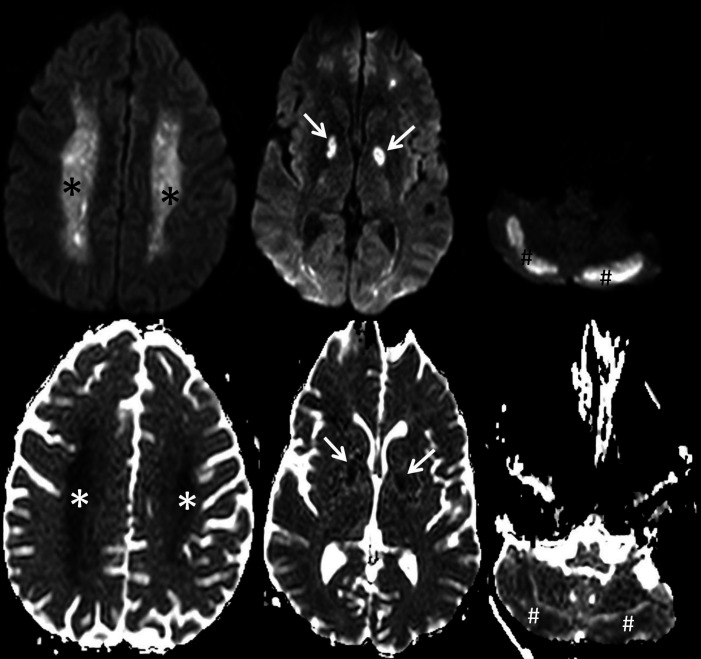
Figure 3.
Axial trace diffusion weighted images (top row) and corresponding apparent diffusion coefficient maps (bottom row) of the brain showing symmetrical confluent reduced diffusivity throughout the bilateral centrum semiovale (asterisks), globus pallidus (arrows) and posterior cerebellar hemispheres (hash tags).

