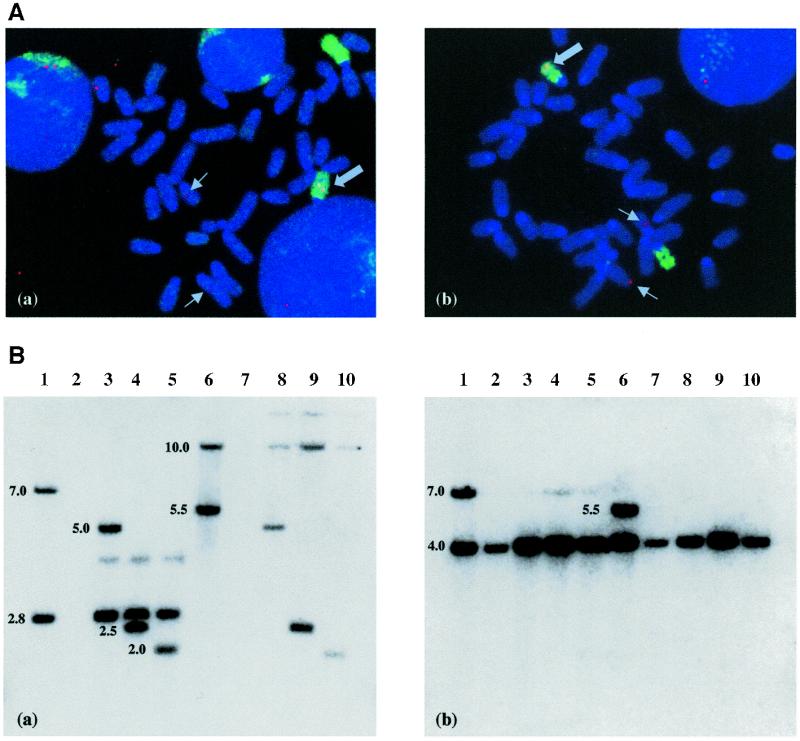
Figure 3.

Structural analysis of primary integrants and secondary targeted cells. (A) FISH analysis of clones 91 (a) and 710 (b). Chromosome spreads were hybridised with a probe generated by nick translation of the plasmid pOct1.9 and painted with chromosome 7-specific (a) and chromosome 13-specific (b) fluorescent probes. FISH signals on chromosomes 7 (a) and 13 (b) are indicated with arrows. The signals detectable on non-painted chromosomes are the result of hybridisation with the endogenous Oct4 gene (chromosome 17). (B) Southern blot analysis of clones 91 and 710 and their targeted derivatives. The position of the probes is indicated in Figure 1. DNA was digested with SacI, blotted and probed with the lacZ coding sequence (a) and a fragment of the Oct promoter (b). Lane 1, clone 91; lane 2, HMI ES cells; lanes 3–5, clone 91 derivatives targeted with pOct/TG (3), pOct/Hox (4) and pOct/Myf (5), respectively; lane 6, clone 710; lane 7, HMI ES cells; lanes 8–10, clone 710 derivatives targeted with pOct/TG (8), pOct/Hox (9) and pOct/Myf (10), respectively. Sizes of bands are given to the left in kb. The faint bands in (a) (lanes 3–5 and 8–10) are consistent with those expected from partial digestion.
