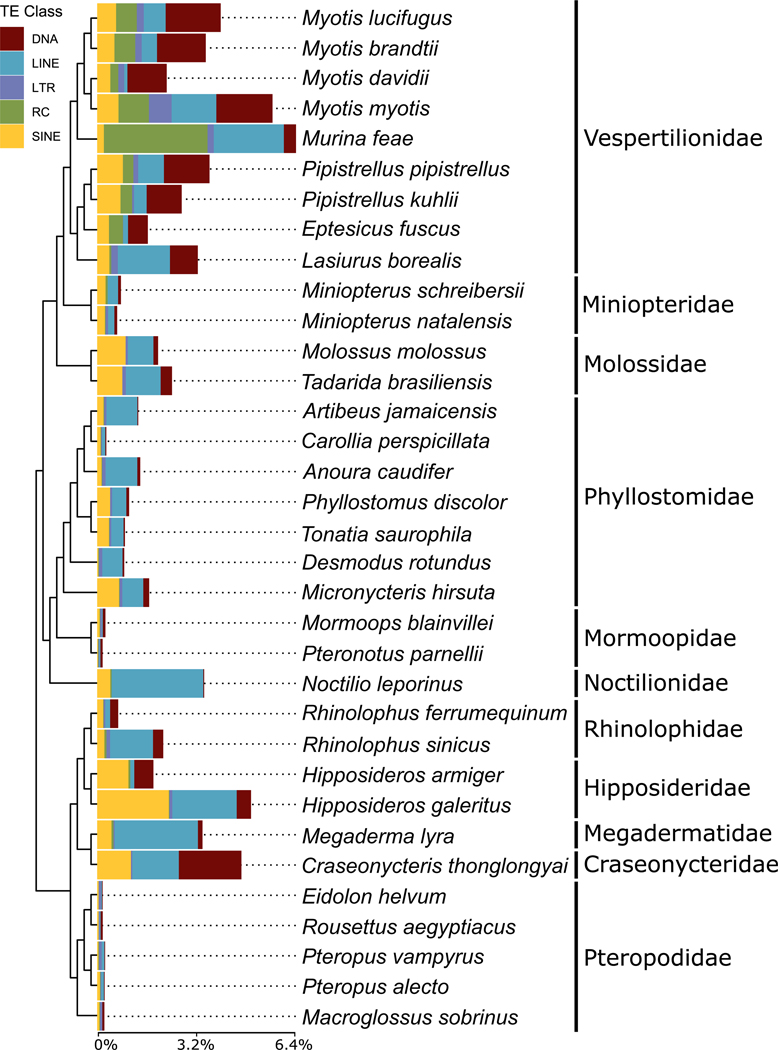
Fig. 4. Stacked bar charts depicting proportions of recently accumulated TEs (<4% kimura divergence from consensus TE) in bats.
Data are organized by TE classification and plotted onto the tips of the chiropteran portion of the mammalian tree, adapted from (65).

