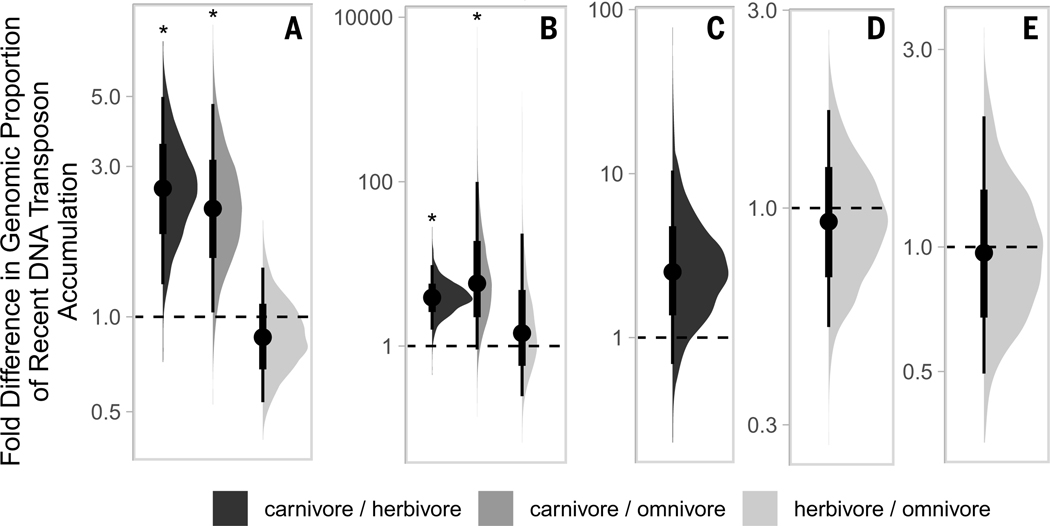
Fig. 6. Half eye plots depicting fold differences in recent DNA transposon accumulation among three dietary phenotypes: carnivore, herbivore, and omnivore.
Instead of showing the estimated values for each of the diets, these plots depict the fold ratio between each diet pair, so that the plot itself shows statistical significance. Comparisons for which the thin line does not overlap with 1 are significant (indicated by asterisks). Plots correspond to the following taxonomic groups: (A) placental mammals [R2 estimated at 0.92 (95% high probability density, 0.79 to 0.97)], (B) Artiodactyla [R2 estimated at 0.64 (95% high probability density, 0.32 to 0.78)], (C) Chiroptera [R2 estimated at 0.34 (95% high probability density, 0.02 to 0.86)], (D) Primates [R2 estimated at 0.18 (95% high probability density, 0.00 to 0.58)], and (E) Rodentia [R2 estimated at 0.07 (95% high probability density, 0.00 to 0.28)].

