
Figure 2.
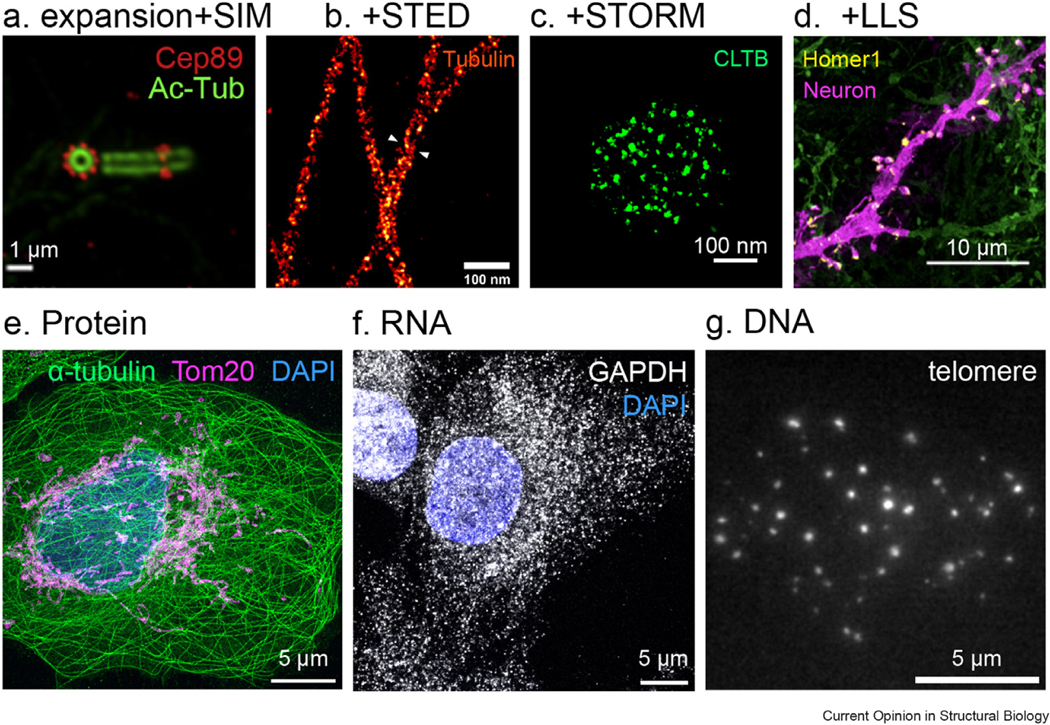
Expansion microscopy images of proteins, RNAs and DNAs on different types of microscopes. (a) U-ExM structured illumination microscopy (SIM) image of cilia immunostained with Cep89 (red) and acetylated tubulin (green) [24]. (b) ExSTED image of microtubules stained with tubulin [25]. (c) LR-ExSTORM image of clathrin-coated pits in a HeLa cell overexpressing SNAP-clathrin light chain b (CLTB) [19]. (d) Expansion lattice light-sheet (ExLLS) image of neuron (magenta, green) immunostained with synaptic proteins Homer1 (yellow) [50]. (e) LR-ExM confocal image of microtubules labeled with anti-α-tubulin antibodies (green), mitochondria labeled with anti-Tom20 antibodies (magenta), and DNA stained with DAPI (4′,6-diamidino-2-phenylindole) (blue) in a U2OS cell (data from our lab). (f) ExFISH confocal image of GAPDH labeled with DNA oligos (gray) and DNA (blue) of a HeLa cell (data from our lab). (g) ExM image of telomere (gray) in chromatin of an IMCD3 cell (data from our lab). Scale bars: 100 nm (a and c), 1 μm (b), 10 μm (d), 5 μm (e–g).