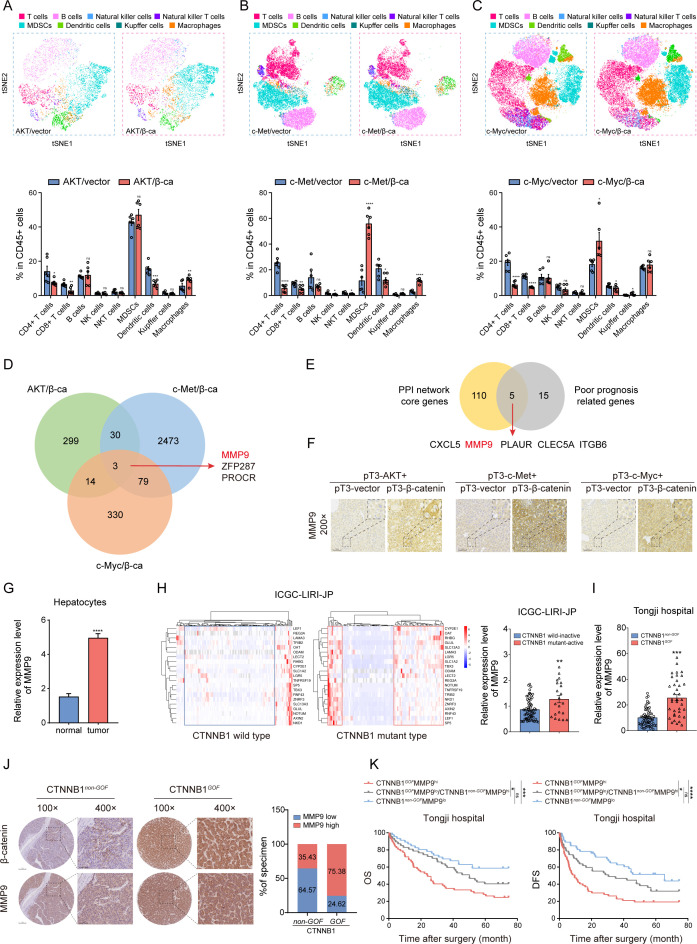
Figure 1.
MMP9 is upregulated in CTNNB1 GOF HCC (A–C) The t-SNE plot and composition of key immune cells in the three groups of CTNNB1 GOF HCC models via HTVi of activated AKT (myr-AKT)/β-catenin (ΔN90-β-catenin), c-Met/β-catenin and c-Myc (MYC-IRES-Luc)/β-catenin plasmids (n=6). (D) Venn diagram illustrating the overlap of upregulated genes in the three groups of CTNNB1 GOF HCC models. (E) Venn diagram of core genes positively correlated with immune regulation and poor prognosis in TCGA dataset. (F) Representative images of IHC staining for MMP9 in the three groups of CTNNB1 GOF HCC models. (G) The mRNA expression level of MMP9 between normal hepatocytes and tumour cells in 10 HCC patients (normal, n=1788; tumour, n=14 202). (H) HCCs were categorised into four clusters using a 21-gene-signature in ICGC-LIRI-JP dataset (left panel). The mRNA expression level of MMP9 in the CTNNB1 wild inactive type and CTNNB1 mutant active type HCC tissue (right panel) (n=86). (I) The mRNA expression level of MMP9 in the CTNNB1 non-GOF and CTNNB1 GOF HCC tissue from Tongji cohort (n=99). (J) Representative images of IHC staining for β-catenin and MMP9 in the CTNNB1 non-GOF and CTNNB1 GOF HCC tissue from Tongji cohort. The statistical results are shown on the right (n=196). (K) Kaplan-Meier analysis of the OS and DFS of patients with HCC from Tongji cohort based on the CTNNB1 GOF and MMP9 IHC staining score (n=104). ns, no significance, *p<0.05, **p<0.01, ***p<0.001, ****p<0.0001. Mean±SEM. Unpaired Student’s t-test (A–C, G, H, I), Log-rank test (K). CTNNB1 GOF , gain of function mutations in CTNNB1; DFS, disease-free survival; HCC, hepatocellular carcinoma; HTVi, hydrodynamic tail vein injection; ICGC, International Cancer Genome Consortium; IHC, immunohistochemistry; OS, overall survival; t-SNE, t-distributed stochastic neighbour embedding; TCGA, The Cancer Genome Atlas.

