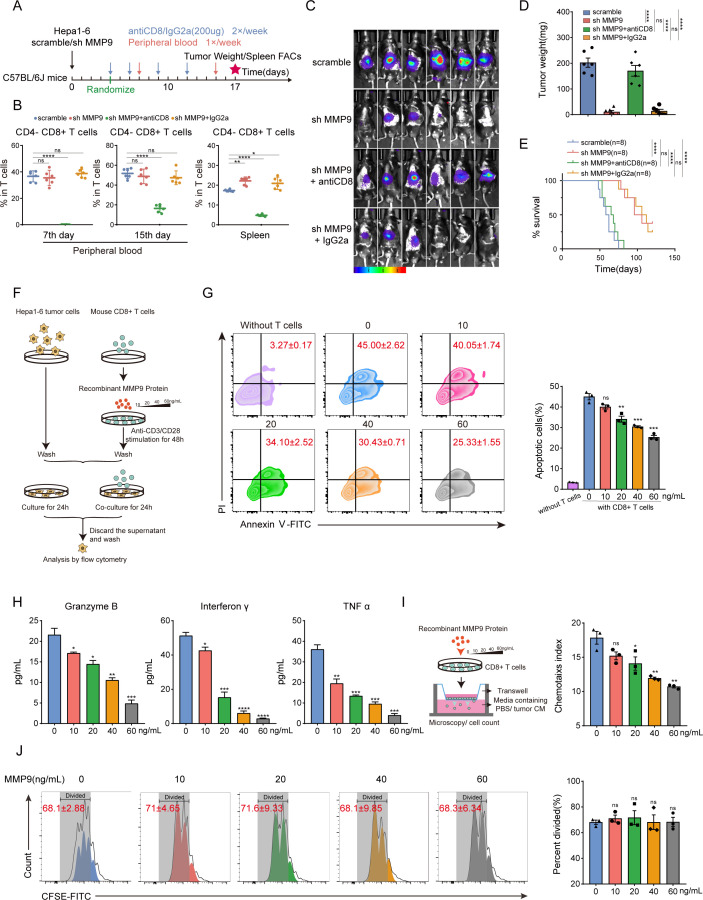
Figure 3.
MMP9 inhibits activation and migration of CD8+ T cells (A) Schematic representation of the treatment schedule for CD8-neutralising antibodies or IgG2a. (B) Flow cytometry analysis of depletion efficiency of CD8+ T cells from peripheral blood and spleen tissue. (C) The bioluminescent images of Hepa1-6 tumours from the orthotopic allograft tumour model of C57BL/6 J mice obtained at the endpoint. (D) The tumour weight of C57BL/6 J mouse models (CD8-neutralising antibodies, 200 µg/mice; IgG2a, 200 µg/mice, n=6). (E) Survival curves of mice in each group of C57BL/6 J mouse models (n=8). (F) CD8+ T cells were stimulated with MMP9 (10/20/40/60 ng/mL) and cocultured with Hepa1-6 cells for 24 hours. (G) Apoptosis of Hepa1-6 cells caused by CD8+ T cells stimulated with MMP9 was measured using Annexin V—PI staining. (H) CD8+ T cells were stimulated with MMP9 (10/20/40/60 ng/mL) followed by Elisa to detect the granzyme B, IFN-γ and TNFα secretion level from culture medium supernatant. (I) CD8+ T cells with the indicated treatments were determined by the transwell assay, and the chemotaxis index was shown. (J) The CFSE proliferation analyses of CD8+ T cells stimulated with MMP9 (10/20/40/60 ng/mL). ns, no significance, *p<0.05, **p<0.01, ***p<0.001, ****p<0.0001. Mean±SEM. One-way ANOVA with Tukey’s multiple comparisons test (B,D), unpaired Student’s t-test (G–J), log-rank test (E). ANOVA, analysis of variance; CM, conditioned medium; FACs, Fluorescence-activated cell staining; PI, propidium iodide; TNF α, tumour necrosis factor α.

