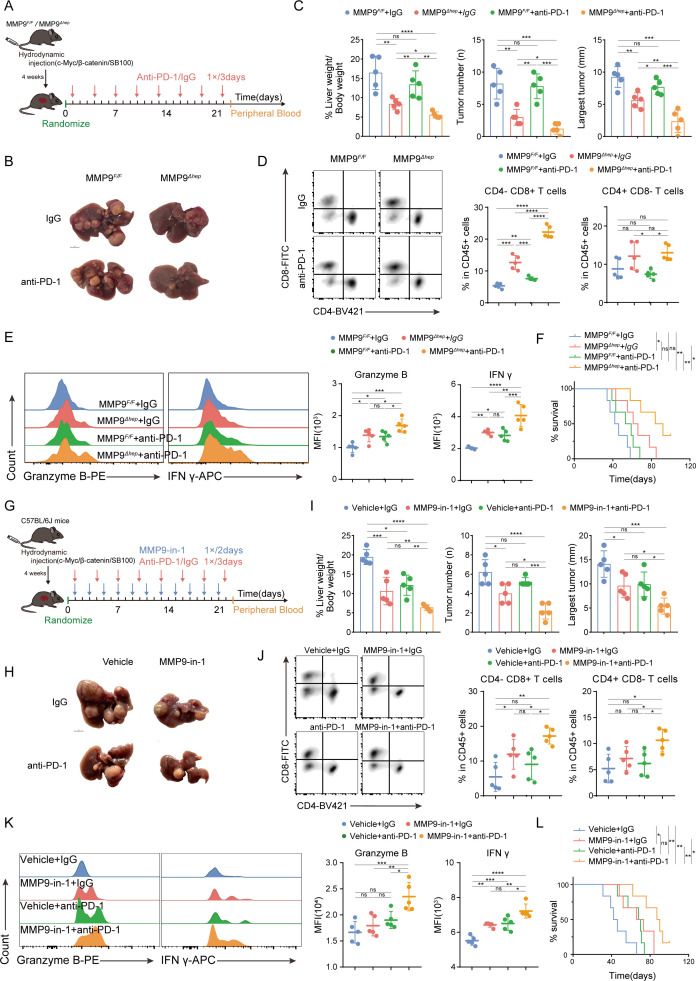
Figure 4.
MMP9 blockade improves the TIME and potentiates anti-PD-1 efficacy in CTNNB1 GOF HCC (A) Schematic representation of the therapy schedule for MMP9 CKO, anti-PD-1 or combination therapy. (B, C) Representative images and the statistical results from spontaneous HCC models that received the indicated treatments (anti-PD-1, 200 µg/mice; IgG, 200 µg/mice, n=5). (D, E) Representative flow cytometry data showing the proportion of T cells and MFI of granzyme B and IFN-γ on CD8+ T cells in tumour tissue from spontaneous HCC models. The statistics results were shown on the right. (F) Survival curves of mice in each group of spontaneous HCC models (n=6). (G) Schematic representation of the therapy schedule for MMP9-in-1, anti-PD-1 or combination therapy. (H, I) Representative images and the statistical results from spontaneous HCC models that received the indicated treatments (MMP9-in-1, 20 mg/kg; anti-PD-1, 200 µg/mice; IgG, 200 µg/mice, n=5). (J, K) Representative flow cytometry data showing the proportion of T cells and MFI of granzyme B and IFN-γ on CD8+ T cells in tumour tissue from spontaneous HCC models. The statistics results were shown on the right. (L) Survival curves of mice in each group of spontaneous HCC models (n=6). ns, no significance, *p<0.05, **p<0.01, ***p<0.001, ****p<0.0001. Mean±SEM. One-way ANOVA with Tukey’s multiple comparisons test (C–E, I–K), Log-rank test (F, L). ANOVA, analysis of variance; CKO, conditional knockout; HCC, hepatocellular carcinoma; MFI, mean fluorescence intensity; TIME, tumour immune microenvironment.

