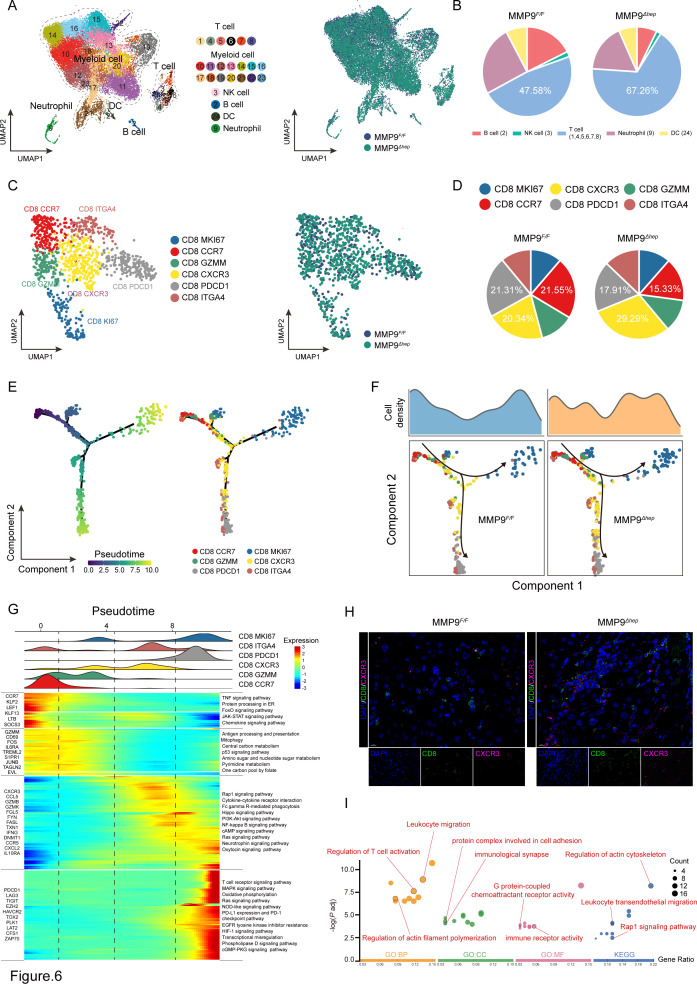
Figure 6.
MMP9 suppresses the infiltration of CD8+CXCR3+ T cells in CTNNB1 GOF HCC (A) The UMAP plot, showing the annotation and colour codes for immune cell types in the HCC ecosystem (left panel), and MMP9 F/F and MMP9 Δhep origins (right panel). (B) Tortadiagram indicating the proportion of non-myeloid immune cells. (C) The UMAP plot, showing the annotation and colour codes for CD8+ T cell types (left panel), and MMP9 F/F and MMP9 Δhep origins (right panel). (D) Tortadiagram indicating the proportion of CD8+ T cells from MMP9 F/F and MMP9 Δhep samples. (E) Pseudotime-ordered analysis of CD8+ T cells from MMP9 F/F and MMP9 Δhep samples. T cell subtypes are labelled by colours. (F) Two-dimensional graph of the pseudotime-ordered CD8+ T cells, from MMP9 F/F and MMP9 Δhep samples. The cell density distribution, by state, is shown at the top of the figure. (G) Heatmap showing the dynamic changes in gene expression along the pseudotime (lower panel). The distribution of CD8 subtypes during the transition (divided into 4 phases), along with the pseudo-time. Subtypes are labelled by colours (upper panel). (H) Representative images of immunofluorescence costaining for CD8 (green) with CXCR3 (pink) in the MMP9 F/F and MMP9 Δhep samples. (I) GO and KEGG pathway enrichment analysis of CD8+CXCR3+ T cells. GO, Gene Ontology; KEGG, Kyoto Encyclopaedia of Genes and Genomes; UMAP, Unsupervised uniform manifold approximation and projection.

