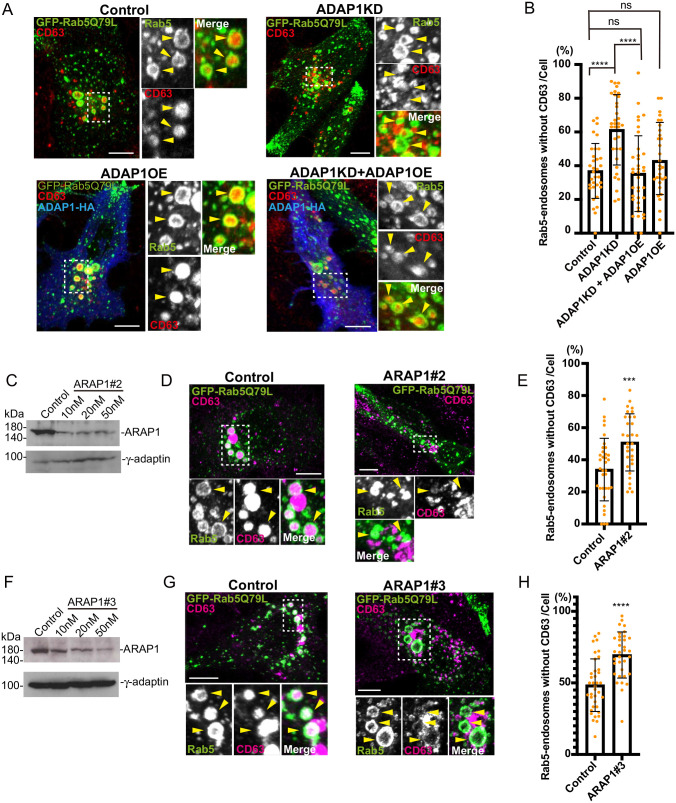
Fig. 2.
The increase in endosomes without CD63 in ADAP1 and ARAP1KD cells is not due to off-target effects. (A) MCF7 transfected control or ADAP1 siRNA were transfected with human ADAP1-HA (ADAP1 overexpression; ADAP1OE, blue) and GFP-Rab5Q79L (green). CD63 was stained with the CD63 antibody (red). The insets were enlarged and Rab5 endosomes are indicated with arrowheads. CD63 signal was seen in the control, while the signal disappeared in ADAP1KD cells. In ADAP1KD+ADAP1OE cells, the CD63 signal in the endosome was recovered. ADAP1OE cells did not show much effect on CD63 in endosomes. (B) The experiment in A was repeated three times. More than 10 cells were counted per experiment and total more than 30 cells were quantified. The percentage of endosomes without CD63 was shown with s.d. Control, n=33; ADAP1KD, n=34; ADAP1KD+ADAP1OE, n=37; ADAP1OE, n=31. The Mann–Whitney test was performed. ****P<0.0001; ns, not significant. (C) MCF7 was transfected with siRNA ARAP1 number 2 as indicated and subjected to western blotting. (D) The cells were transfected with control or ARAP1 number 2 siRNA and immunofluorescence was performed as in A. (E) The experiment in D was repeated three times. More than 10 cells were counted per experiment and total more than 30 cells were quantified. Rab5 endosomes without CD63 was shown as in B. Control, n=35; ARAP1 number 2, n=31. The Mann–Whitney test was performed, **P<0.01. (F) ARAP1 number 3 siRNA was tested for western blotting as in C. (G) Immunofluorescence was performed for control and ARAP1 number 3 cells. (H) The experiment in G was repeated three times. More than 10 cells were counted per experiment and total more than 30 cells were quantified. Rab5 endosomes without CD63 were quantified. Control, n=34; ARAP1 number 3; n=37. The Mann–Whitney test was performed, ****P<0.0001. Scale bars: 10 µm.

