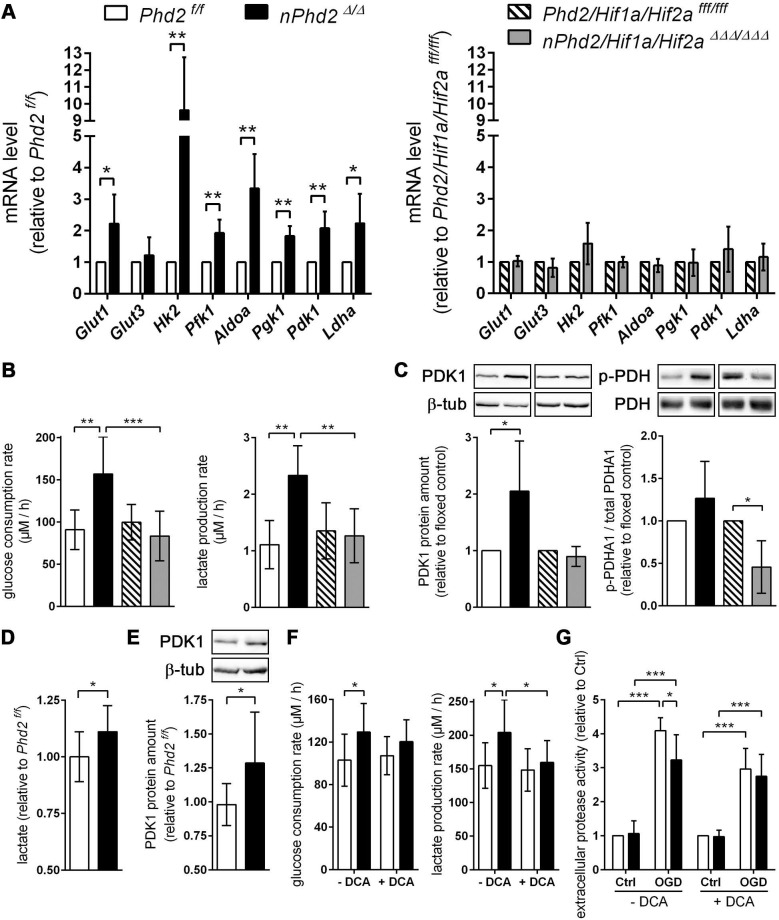
Figure 2.
PHD2 deficiency in neurons promotes a HIF-dependent metabolic switch from mitochondrial oxidative phosphorylation to aerobic glycolysis. (A) Real-time RT-PCR was used to determine transcript levels of HIF target genes involved in glucose metabolism in neurons derived from neonatal Phd2 f/f, nPhd2 Δ/Δ, Phd2/Hif1a/Hif2a fff/fff and nPhd2/Hif1a/Hif2a ΔΔΔ/ΔΔΔ mice. Values are normalized to Rps12 and expressed as fold change to Phd2 f/f or Phd2/Hif1a/Hif2a fff/fff, respectively (n = 4-5 per group; unpaired two-tailed Student's t test; * p < 0.05, ** p < 0.01). (B) Glucose consumption and extracellular lactate levels were measured in neurons cultured for 24 h under low glucose conditions (n = 4-11 per group; One-way ANOVA with Holm-Sidak's multiple comparisons test; ** p < 0.01, *** p < 0.001). (C) PDK1, p-PDHA1 and total PDHA1 protein levels were quantified by Western blotting. Values are normalized to β-tubulin and expressed as fold change to Phd2 f/f or Phd2/Hif1a/Hif2a fff/fff, respectively (n = 5-11 per group; unpaired two-tailed Student's t test; * p < 0.05). (D) Lactate was quantified in the forebrain of adult Phd2 f/f and nPhd2 Δ/Δ mice. Values are expressed as fold change to Phd2 f/f (n = 13 per group; unpaired two-tailed Student's t test; * p < 0.05). (E) PDK1 protein level in the forebrain was quantified by Western blotting. Values are normalized to β-tubulin and expressed as fold change to Phd2 f/f (n = 10 per group; unpaired two-tailed Student's t test; * p < 0.05). (F) Glucose consumption and extracellular lactate levels were measured in neurons cultured for 24 h in the presence or absence of 5 mM dichloroacetate (DCA) (n = 8-12 per group; Two-way ANOVA with Holm-Sidak's multiple comparisons test; * p < 0.05). (G) Neurons were cultured in the absence or presence of 5 mM DCA for 24 h prior to exposure to OGD conditions (glucose-free aCSF; 0.2% O2) for 4 h. Cells exposed to aCSF (+Glc) under normoxic conditions for 4 h are used as Ctrl. Cell viability was determined using a dead-cell protease activity assay. Values are expressed as fold change of Phd2 f/f cells exposed to normoxic conditions (n = 5 per group; Two-way ANOVA with Holm-Sidak's multiple comparisons test; * p < 0.05, *** p < 0.001).

