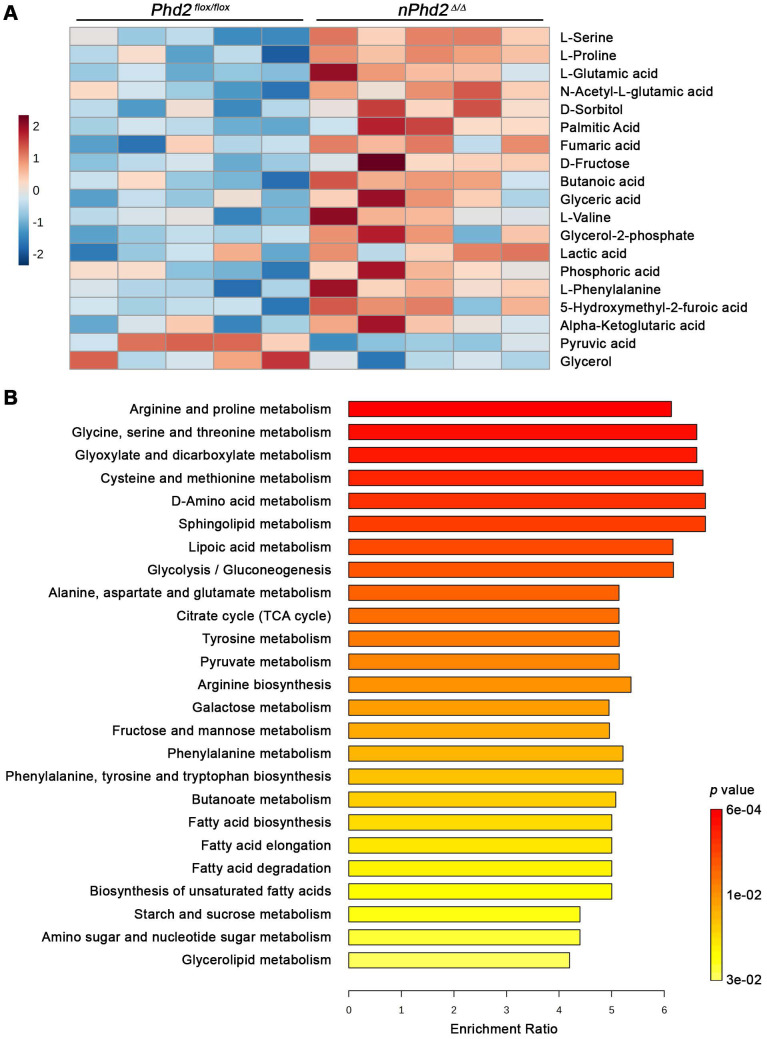
Figure 3.
Neuron-specific PHD2 inactivation leads to substantial changes in metabolite levels related to the brain central carbon metabolism. GC/MS technique was used for metabolic profiling of brain tissue samples derived from adult Phd2 f/f and nPhd2 Δ/Δ mice. (A) Heat map showing 19 significantly differential metabolites in the brain of nPhd2 Δ/Δ mice compared to Phd2 f/f littermates (n = 5 per group; unpaired two-tailed Student's t test; * p < 0.05). (B) Quantitative pathway enrichment analysis of differential metabolites conducted using MetaboAnalyst 6.0 (p-values from pathway enrichment analysis are plotted on the y-axis, and pathway impact values from pathway topology analysis on the x-axis). The enrichment ratio plotted on the x-axis is calculated as the number of hits within a particular metabolic pathway divided by the expected number of hits. The top 25 enriched pathways are shown.

