. 2024 May 20;14(23):16255–16268. doi: 10.1039/d4ra01030b

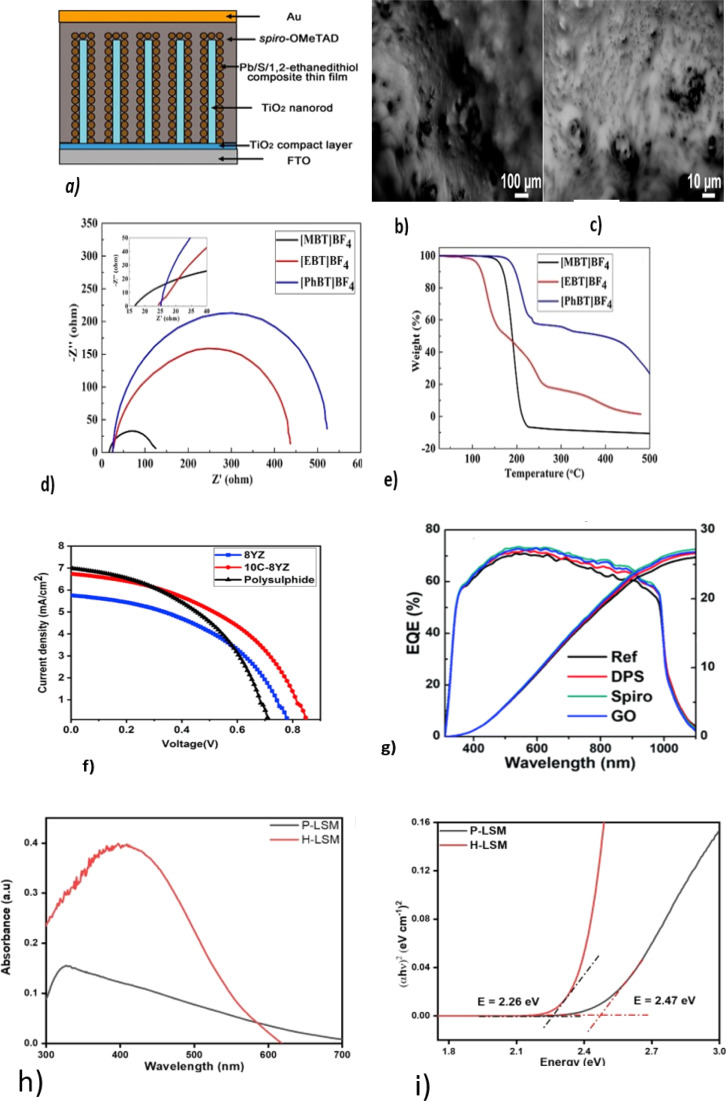
Fig. 6. (a)Schematic diagram of Pb/S/1,2-ethanedithiol composite thin-film-sensitized TiO2 nanorod array solar cells; reproduced from ref. 83 with permission from Springer Nature copyright 2018. (b and c) SEM image of a solid electrolyte at low and high magnifications; reproduced with permission from the American Chemical Society, copyright 2019.88 (d) Nyquist plots of [DHexBIm][X] (X = Br, BF4 and SCN)-based electrolytes; reproduced from ref. 89, with permission from the Royal Society of Chemistry, copyright 2019. (e) TGA curves of OICs [MBT]BF4, [EBT]BF4 and [PhBT]BF4; reproduced from ref. 90. (f) JV curves for the Pechini method and hydrothermal method. (g) EQ and integrated Jsc curves; reprinted from ref. 85. (h) UV-visible spectra and (i) Tauc plots of H-LSM and P-LSM to determine the optical bandgap; reproduced from ref. 97.

Fig. 6