
Figure 5. Number of targets.
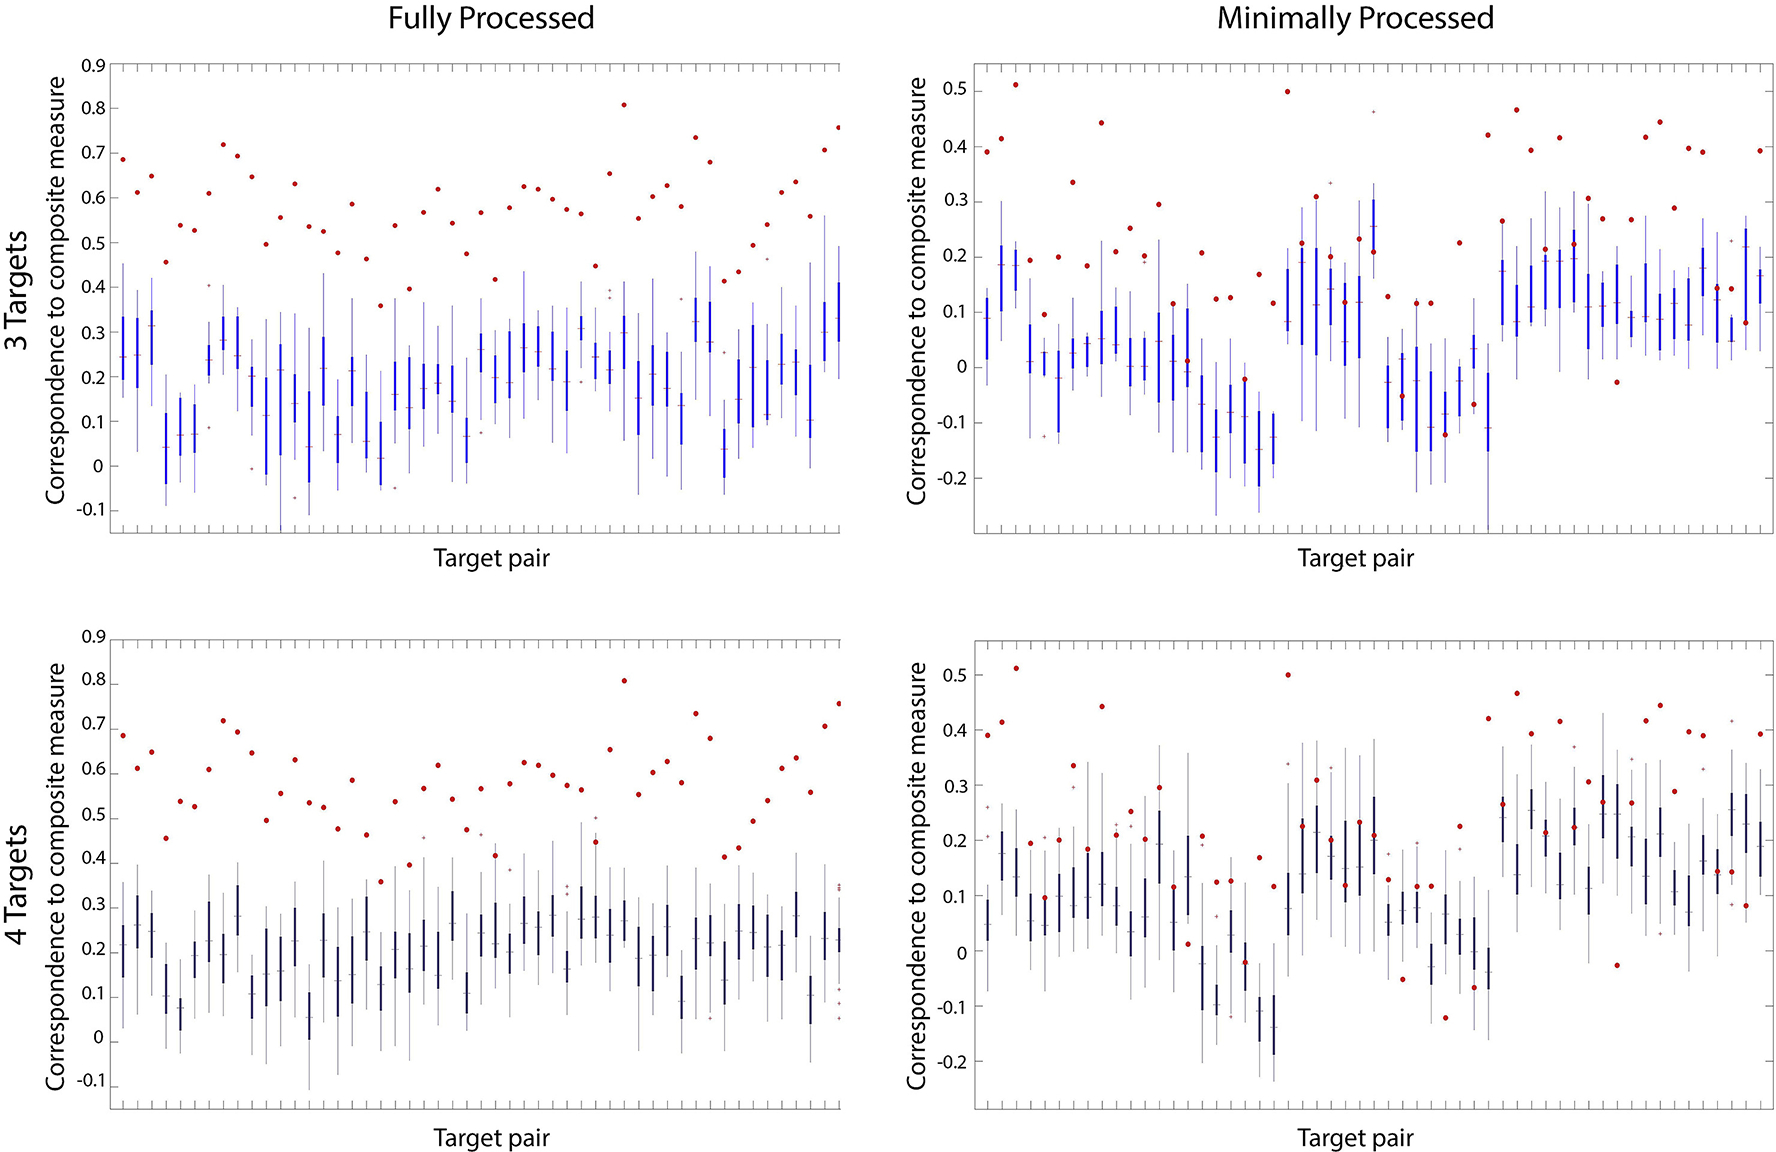
Top: for each target pair, comparing the correlation of the two-point algorithm to the composite measure using just these two targets (red dots) vs. all the possible correlations to the composite measure when adding a third target (box and whisker plots), for the fully processed data (left) and the minimally processed data (right). Bottom: same, but adding any other two targets to each possible target pair. Note that using just two targets gives better results, for all but the target pairs that perform very poorly to begin with.