
Figure 8. Comparing to more traditional correlation methods.
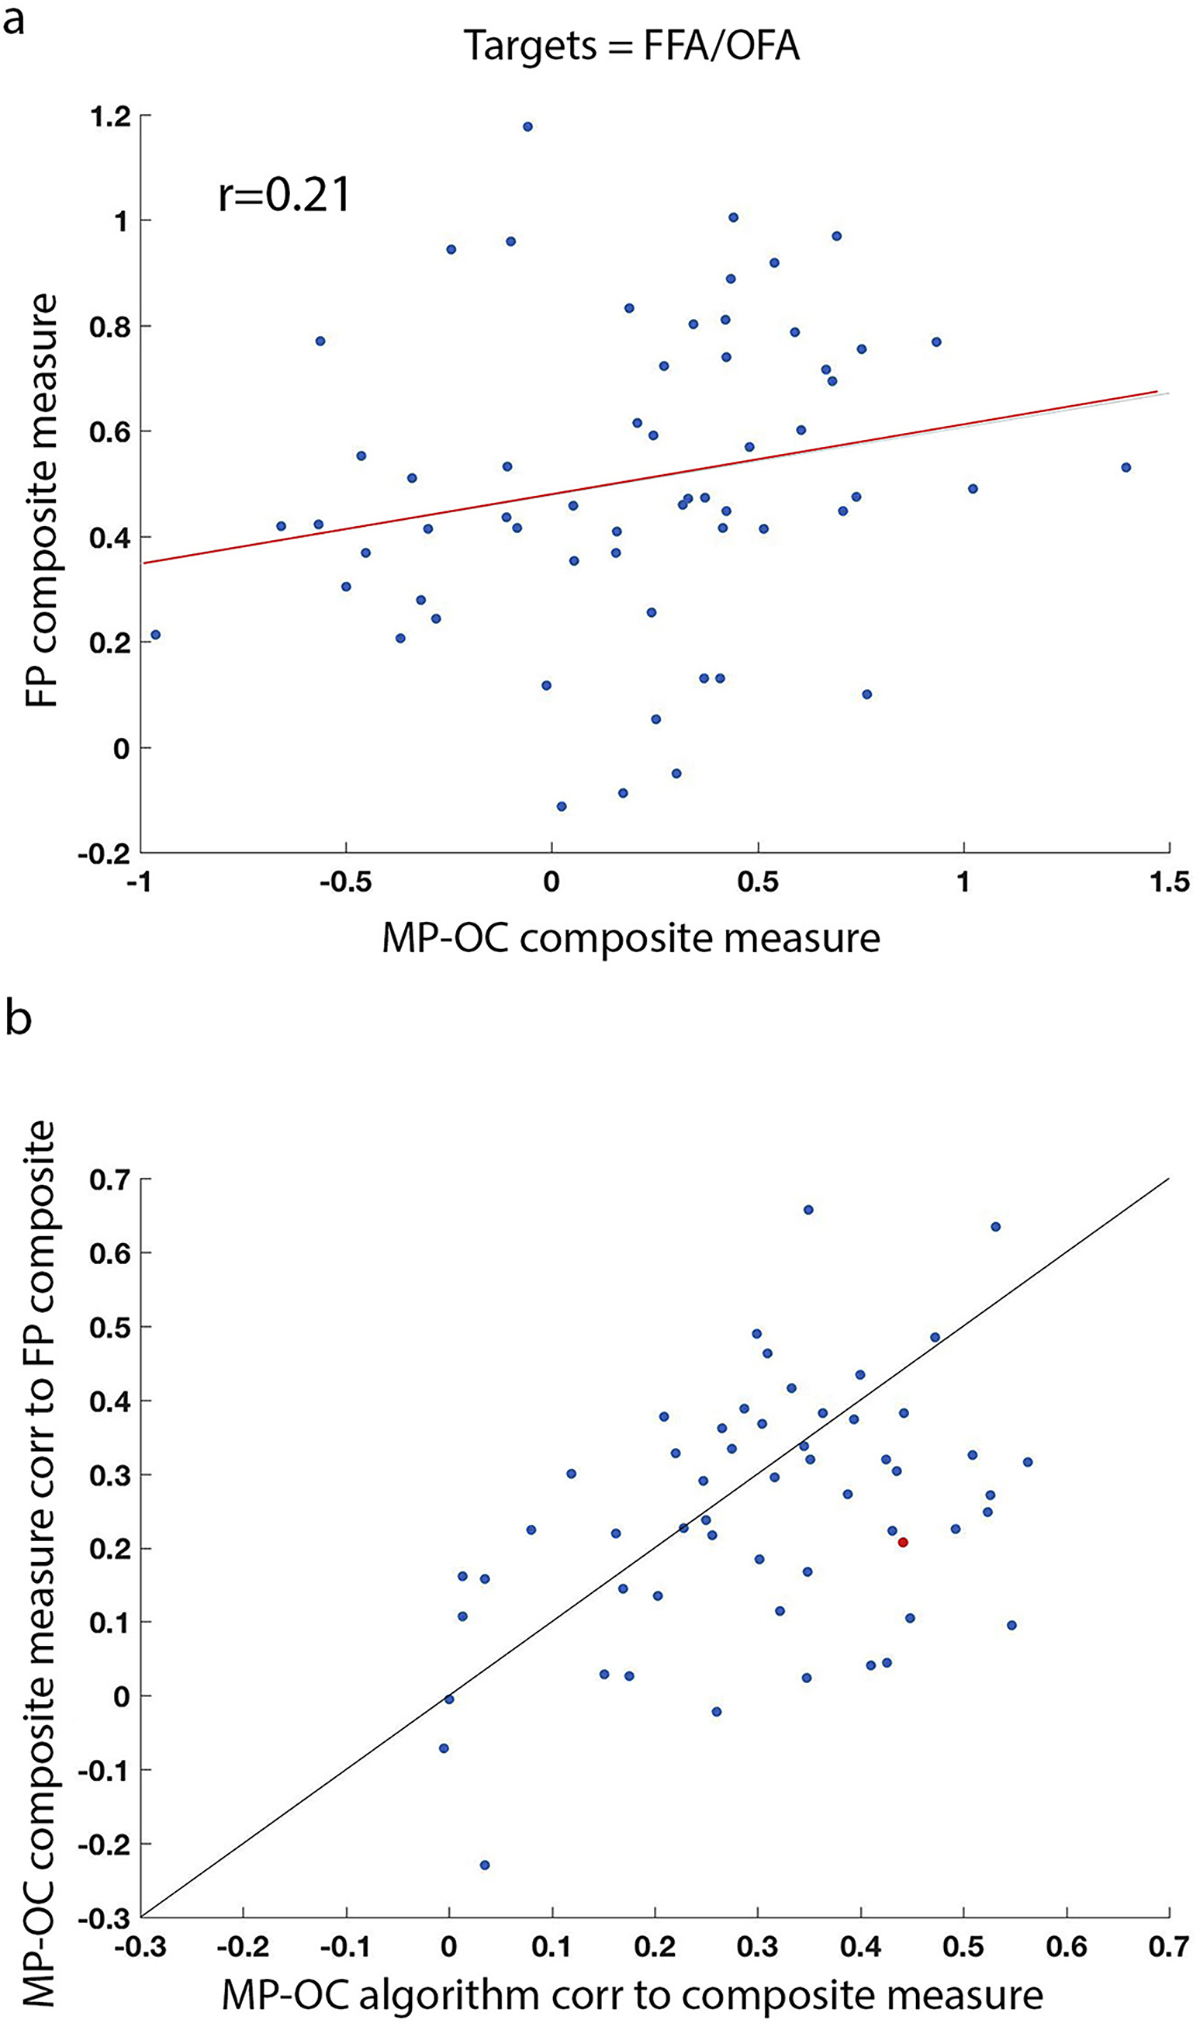
(a) Comparing the composite measure calculated using right FFA and OFA as the targets, on the Minimally Processed Optimally Combined data (MP-OC, x-axis), and the fully processed data (FP, y-axis). Each dot represents the value of the composite measure for one rest scan, for one participant, on the MP-OC data (x) and the FP data (y). (b) Comparing the performance of the two-point algorithm for the MP-OC data (correlation of the algorithm to the composite measure, x-axis), with the correlation of the actual calculation of the composite measure on the MP-OC data with the composite measure calculated on the FP data (y-axis), for all possible target pairs. Example from (a) of the FFA and OFA pair plotted in red. Note that correlations are generally within the same range, and for most possible target pairs there is an advantage for the two-point algorithm over just calculating the composite measure on the MP-OC data using the full time series.