
Figure 5.
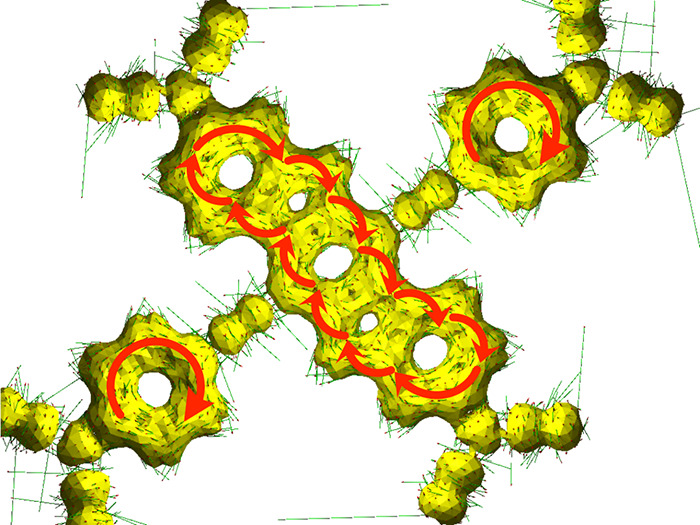
An ACID plot for a singlet state of LS calculated with the PBE0/cc-pVDZ level of theory. See the full version of the ACID plot in Figure S8a in the Supporting Information. Isosurface with value of 0.030.
Official websites use .gov
A
.gov website belongs to an official
government organization in the United States.
Secure .gov websites use HTTPS
A lock (
) or https:// means you've safely
connected to the .gov website. Share sensitive
information only on official, secure websites.
An ACID plot for a singlet state of LS calculated with the PBE0/cc-pVDZ level of theory. See the full version of the ACID plot in Figure S8a in the Supporting Information. Isosurface with value of 0.030.