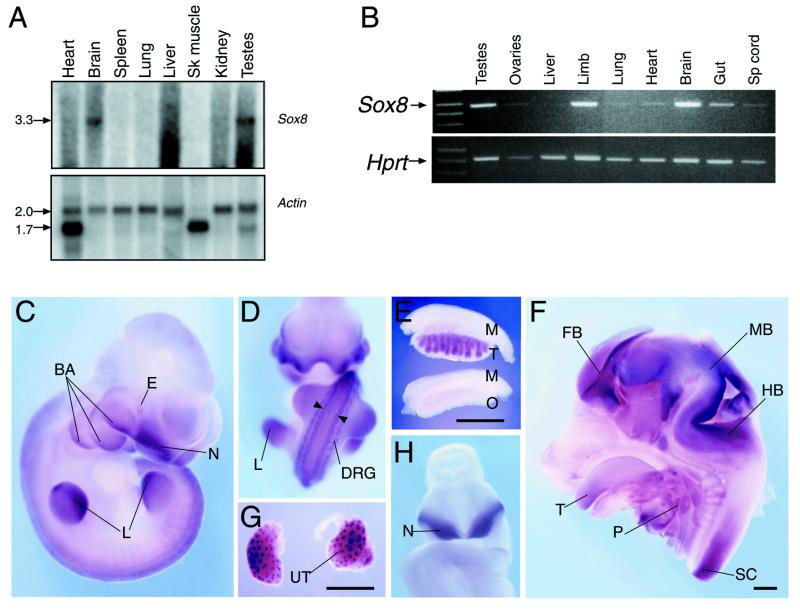
Figure 4.
Expression of murine Sox8. (A) Northern blot showing expression in adult mouse tissues. (Upper) Sox8 probe; (lower) β-actin. Band sizes, in kb, are represented on the left. Sk muscle refers to skeletal muscle. (B) RT–PCR analysis of 13.5 d.p.c. foetal tissues. (Upper) Sox8; (lower) Hprt. Sp cord refers to spinal cord. (C–H) Whole mount in situ hybridisation analysis of Sox8 expression. (C) 10.5 d.p.c. mouse embryo, side view. BA, branchial arches; E, eye; N, nasal invagination; L, limb. (D) 10.5 d.p.c. whole embryo, anterior view. L, limb; DRG, dorsal root ganglia. Arrowheads indicate two stripes of expression at the lateral margins of the dorsal spinal cord. (E) 13.5 d.p.c. testes and ovaries. M, mesonephros; T, testis; O, ovary. (F) 13.5 d.p.c. head, bisected, medial view. FB, forebrain; MB, midbrain; HB, hindbrain; T, tongue; P, pharyngeal region; SP, spinal cord. (G) 13.5 d.p.c. kidneys. UT, ureteric tree. (H) 9.5 d.p.c. whole embryo, anterior view. N, nasal invagination. Bars in (E), (F) and (G) represent 1 mm.

