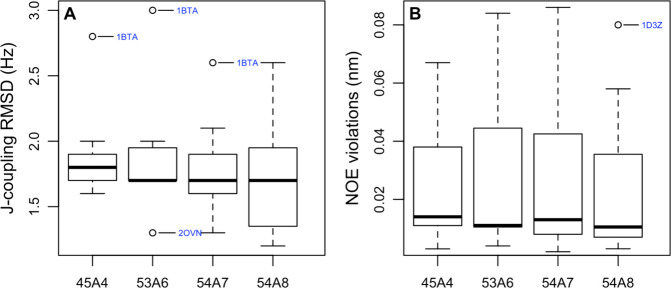
Figure 6.
Boxplots showing (A) the RMSD between the J-coupling value measured experimentally and the J-coupling value calculated from the simulations configurations and (B) the average NOE violation. Only systems for which the starting conformation was derived based on NMR data and for which the corresponding experimental data were available were considered. The calculated values were based on conformations sampled during the last 5 ns of each simulation. Data from different replicas were pooled. The average NOE violation for each protein was obtained by summing the NOE distance violations and dividing by the total number of reported NOEs.

