Fig. 2.
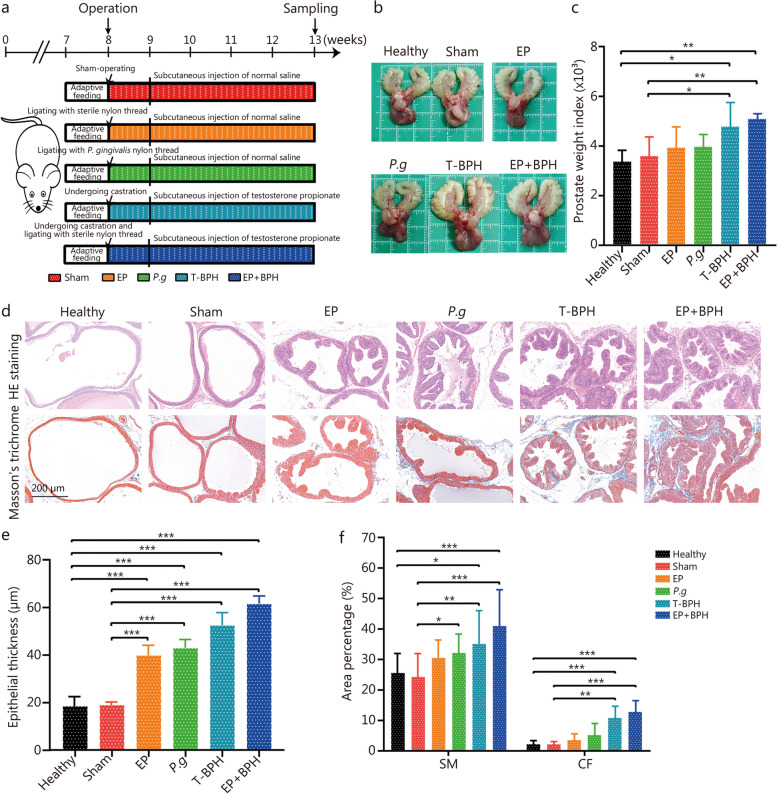
Experimental periodontitis promoted BPH development in rat prostate tissues. a Flowchart of experiment periodontitis and BPH rat model establishment. b Photographs of ventral prostate, bladder, and seminal vesicle from the healthy, sham, EP, P.g, T-BPH and EP + BPH groups. c Histogram of prostate weight index (prostate weight of each animal/body weight of each animal) × 1000. d Representative figures from HE staining and Masson’s trichrome staining for the prostate tissues. (original magnification ×200). e Bar graph for area percentage of epithelia from the groups. f Bar graph for area percentage of SM and CF from the groups. Data are expressed as mean ± SD. *P < 0.05, **P < 0.01, ***P < 0.001. EP ligature-induced experimental periodontitis group, P.g Porphyromonas gingivalis induced BPH group, T-BPH testosterone-induced BPH group, EP + BPH composite group of EP and BPH, HE hematoxylin and eosin, SM smooth muscle, CF collagen fibers

