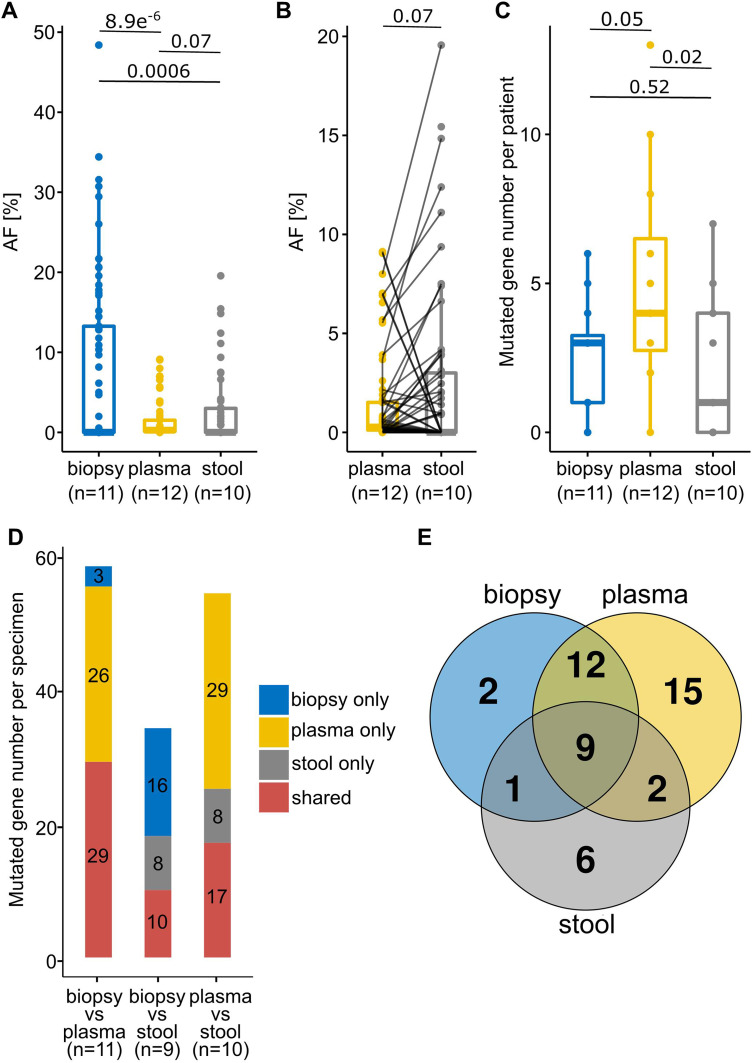
Figure 2.
Mutational allelic frequencies, numbers, and direct comparisons of identified mutations in different specimens. (A) Allelic frequencies (AF) of mutations identified in different sample specimens. (B) Comparison of AF of detected mutations in paired plasma and stool samples derived from the same patients. (C) Number of identified mutations per patient within different sample specimens. (D) Number of shared and non-shared mutations in the same patient across different specimen comparisons. (E) Number of intersecting mutations in different specimens across all patients (n = 9) from whom all three specimens were analyzed. Only mutations that are covered by both the SureSelectTM (biopsy) and AVENIOTM (plasma and stool) panel are depicted. Numbers above lines in graphs (A–C) represent p-values.

