
Figure 3.
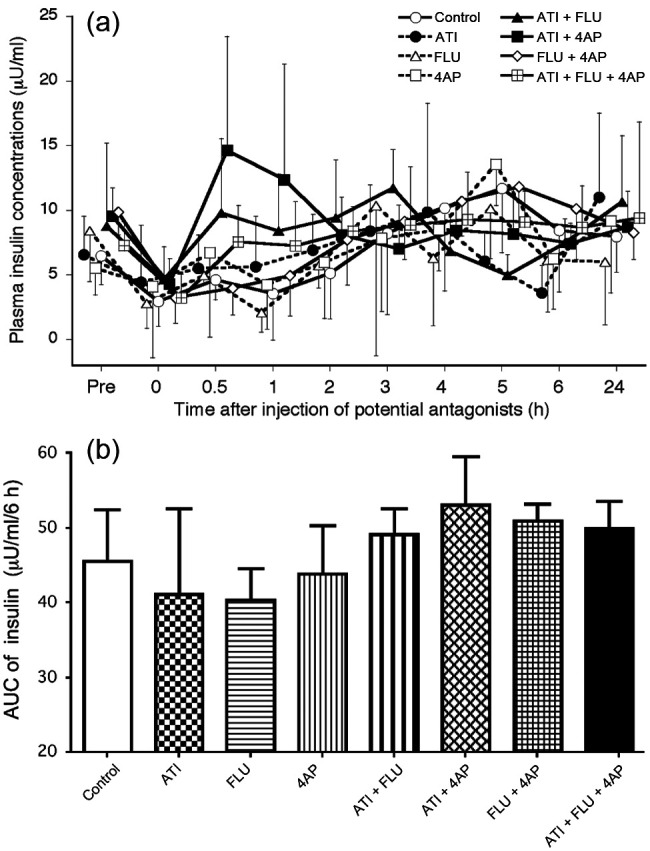
(a) Changes in plasma insulin concentrations after administration of antagonists, either alone or in combination, in seven cats anaesthetised with medetomidine, midazolam and ketamine (MED + MID + KET). (b) Area under the curve (AUC) data from 0–6 h for insulin values after administration of antagonists. Plots, abbreviations and footnotes (a–g) are as described in Figure 1